


 本文介绍了理解Web性能监控的重要性,探讨了如何通过使用各种工具和技术,如Java、Web、JS、Python和Vue,来构建一个强大的前端性能监控平台,以优化用户体验并提升网站性能。
web前端性能监控平台
In this article, we will try to understand performance monitoring in web apps and answer questions like: How to define a perf regression? What should be the end goal and how should we measure it? While developing new features, how can we ensure the same or better than before performance?
在本文中,我们将尝试了解Web应用程序中的性能监视,并回答以下问题:如何定义性能回归? 最终目标应该是什么,我们应该如何衡量? 在开发新功能时,我们如何确保性能比以前更好或更高?
Outline 📑▶ User profiling
  ▶ Logging network details
  ▶ Logging device and browser information
  ▶ Logging load type
  ▶ Logging scenario type
▶ Monitoring environment and common perf metrics
  ▶ Synthetic testing
  ▶ Real user monitoring
▶ Choosing the right metrics
▶ Logging custom metrics
  ▶ Capturing custom metrics with lighthouse
▶ Conclusion
In real-world applications, there are a lot of factors that govern the performance of a website like the size of JavaScript and other assets delivered, HTTP 2 support, API timings, Service Worker support, CPU cores, and device memory, etc which makes performance monitoring a puzzling task.
在现实世界的应用程序中,有许多因素决定着网站的性能,例如JavaScript的大小和所交付的其他资产,HTTP 2支持,API计时,Service Worker支持,CPU内核和设备内存等,性能监控一个令人费解的任务。
Further to add to the complexity, a combination of these choices along with user device capabilities and network conditions determines how well a website is performing.
除了增加复杂性之外,这些选择以及用户设备功能和网络条件的组合决定了网站的运行状况。
Fast device + Slow internet != Slow device + Good internet用户分析 (User profiling)
The website's performance can vary for different users because of differences like device condition, memory usage, chipset, network status, battery, etc.
网站的性能可能因设备状况,内存使用情况,芯片组,网络状态,电池等差异而针对不同用户而有所不同。
Knowing our users is the first step towards monitoring performance.
了解我们的用户是监控性能的第一步。
A good way to profile users is to track metrics like network information, device details, browser and OS information, etc. Narrowing down the end-users this way helps in effectively monitoring and selectively targetting the target audience based on the largest set or most effected users first.
记录用户资料的一种好方法是跟踪指标,例如网络信息,设备详细信息,浏览器和操作系统信息等。以这种方式缩小最终用户的范围有助于根据最大的组或受影响最大的组来有效地监视和选择性地定位目标受众用户至上。
记录网络详细信息 (Logging network details)
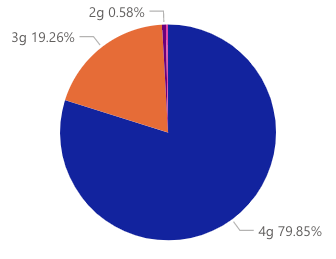
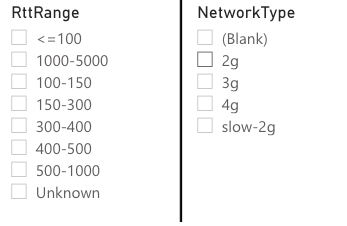
We can log the network details using the 🔗 Chrome Network Information API. It provides a handful of network-related information, out of which we can use network type i.e 2G, 3G, 4G, and RTT (Round Trip Time) to bucketize users.
我们可以使用h Crome网络信息API记录网络详细信息 。 它提供了一些与网络有关的信息,我们可以使用其中的网络类型(例如2G,3G,4G和RTT(往返时间))对用户进行存储。
Round-trip time (RTT) is the duration, measured in milliseconds, from when a browser sends a request to when it receives a response from a server
往返时间(RTT)是从浏览器发送请求到收到服务器响应的持续时间(以毫秒为单位)
记录设备和浏览器信息 (Logging device and browser information)
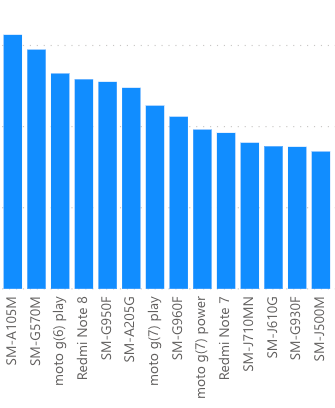
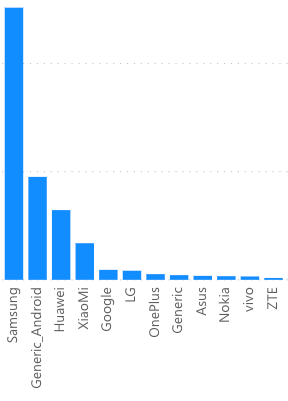
User-Agent that’s available on the client can be used to get the browser name and device-related information like vendor, OS, etc.
客户端上可用的User-Agent可用于获取浏览器名称和与设备相关的信息,例如供应商,操作系统等。
We can either use 🔗 ua-parser-js or we write our own parser to detect common regex patterns to identify these.
我们可以使用ua-parser-js或编写自己的解析器来检测常见的正则表达式模式以识别这些模式。
记录负载类型 (Logging load type)
Performance numbers can vary depending on if a user has visited the website the first time or second time. In the latter case, browser caching will result in faster loading experience. Hence, it’s important to differentiate these scenarios while creating monitoring graphs. We can differentiate based on the first load, repeat load (when some items are cached) and repeat load with Service Worker.
效果数字可能会有所不同,具体取决于用户是第一次还是第二次访问该网站。 在后一种情况下,浏览器缓存将带来更快的加载体验。 因此,在创建监视图时区分这些方案很重要。 我们可以根据首次加载,重复加载( 当某些项目被缓存时 )和使用Service Worker重复加载来进行区分。

记录方案类型 (Logging scenario type)
Sometimes even a simple change in the UI can cause a significant difference in the performance timings. For eg. A first-time user who’s shown a landing video compared to the one who’s not.
有时,即使是对UI的简单更改也可能导致性能计时方面的重大差异。 例如。 首次观看登陆视频的用户与未观看登陆视频的用户相比。
Such cases can be accounted for by logging data points through analytics and later applying filters to bucketize, this helps in defining end goals based on different user-profiles as well as application scenarios.
可以通过以下方式解决此类情况:通过分析记录数据点,然后将过滤器应用于存储桶,这有助于基于不同的用户配置文件和应用程序场景定义最终目标。
By defining filters we can smartly target the users, it also simplifies the task of defining an end goal and efficiently finding the bottlenecks.
通过定义过滤器,我们可以明智地将用户作为目标用户,它还简化了定义最终目标并有效查找瓶颈的任务。
Setting a goal of 2s load time for the users on Samsung Devices to say S8, S9 with 4G network in the repeated load is a better metric to measure and fix compared to simply trying to achieve less than 2s load time.
将三星设备上的用户设置为2s加载时间的目标,例如在重复加载中使用4G网络的S8,S9,是测量和修复的更好指标,相比于仅尝试实现不到2s的加载时间。
That said we eventually want all of our users to have a smooth experience, setting a targetted goal is just a step in that direction.
就是说,我们最终希望所有用户都拥有流畅的体验,设定目标目标只是朝这个方向迈出的一步。
监视环境和常见性能指标 (Monitoring environment and common perf metrics)
Let’s look back at our previous statement. “Saying load time of less than 2s with some conditions”. Here load time is the time from navigation start to the time when the window on load event fires.
让我们回顾一下前面的语句。 “在某些情况下,说加载时间少于2s”。 此处的加载时间是指从导航开始到加载事件窗口触发之间的时间。
Load time a good metric to track and optimize however it doesn’t always give the overall picture of how a website performs from the end-user perspective. Hence, there are other metrics like FP (First Paint), FCP (First contentful paint), FMP (First Meaningful Paint), Visually Complete, TTI (Time to Interactive), etc.
加载时间是跟踪和优化的一个很好的指标,但是,它并不能始终从最终用户的角度全面了解网站的运行情况。 因此,还有其他指标,例如FP(第一绘画),FCP(第一有意思绘画),FMP(第一有意义绘画),视觉完成,TTI(互动时间)等。
If you’re not aware of these metric definitions, it’s a good idea to go through this 🔗 good read on these metrics.
如果您不了解这些指标定义,那么最好仔细阅读这些指标 。
These metrics are generic and provides an overview of performance metrics and helps in defining a perf regression, we can say TTI has regressed by so and so percentage.
这些度量标准是通用的,它们提供了性能度量标准的概述,并有助于定义性能回归,我们可以说TTI的回归百分比是这样。
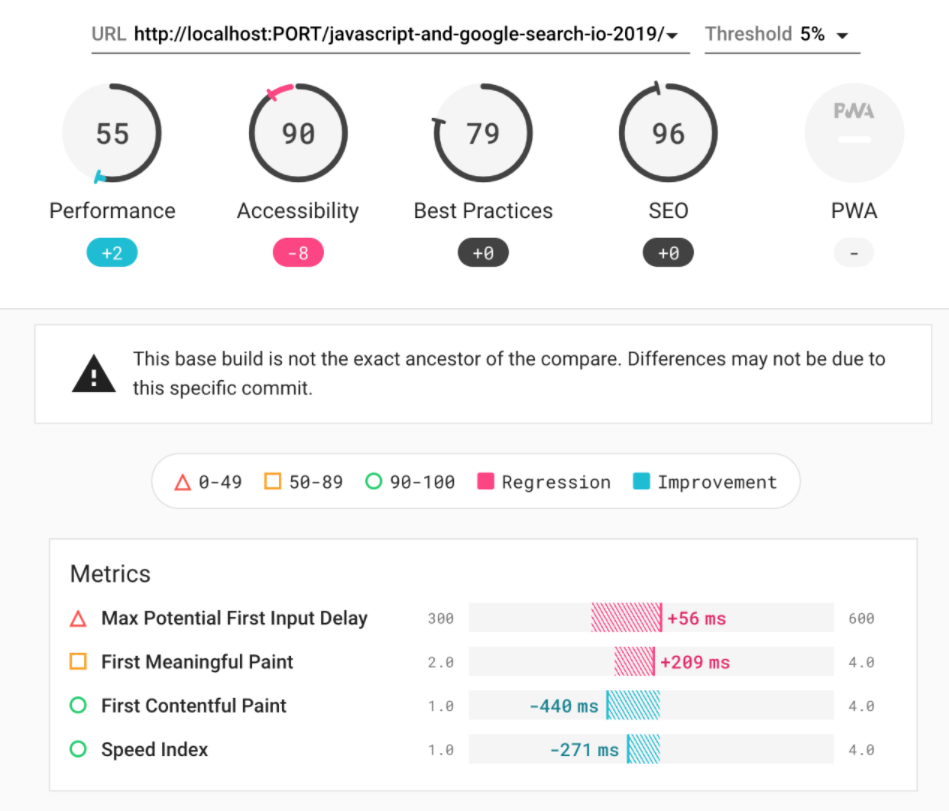
综合测试 (Synthetic testing)
These metrics are provided by tools like 🔗 lighthouse and 🔗 webpagetest which can be run against our website on a regular interval of time by keeping some constants like user profile, network speed, etc to keep track of performance regressions. This kind of lab-like approach is called Synthetic testing.
这些指标是通过工具,如🔗提供的灯塔和🔗 webpagetest能对我们网站上的规则时间间隔通过保持一些常量,如用户配置文件,网络速度等来跟踪性能衰退的运行。 这种类似于实验室的方法称为综合测试。
🔗 lighthouse-ci provides the ability to schedule regular testing monitoring runs, and see differences in these metrics over a period of time or while developing during PR, CI/CD phase.
house lighthouse-ci提供了安排定期测试监视运行的功能,并可以查看一段时间内或在PR,CI / CD阶段开发过程中这些指标的差异。
真实用户监控 (Real user monitoring)
Some of these metrics like FP, FCP, TTI can also be calculated using JavaScript and logged from a real user session along with the user profiling information, thus giving us the Real User Metrics.
FP,FCP,TTI等某些度量标准也可以使用JavaScript进行计算,并与用户配置信息一起从真实用户会话中记录下来,从而为我们提供了真实用户度量标准。
Such metrics are helpful in monitoring performance and identifying performance bottlenecks over a period of time through actual user data.
此类指标有助于监控性能并通过实际用户数据确定一段时间内的性能瓶颈。
选择正确的指标 (Choosing the right metrics)
What are the end-users expecting? Is it a news website? If yes, our goal could be to show above the fold articles first. If it’s a video website, it could be to autoplay video on the landing page or if it’s a live dashboard, we’d want to render it with the latest data.
最终用户期望什么? 是新闻网站吗? 如果是,我们的目标可能是首先显示首屏文章。 如果是视频网站,则可能是在目标网页上自动播放视频,或者如果它是实时仪表板,我们希望使用最新数据进行渲染。
Choosing the right metrics is about defining an end goal and then breaking down the journey into smaller steps which define the step by step progress done to reach that end goal.
选择正确的度量标准是要确定最终目标,然后将旅程分解为较小的步骤,这些步骤逐步定义实现该最终目标的进度。
Defining the end goal is used to track performance and the latter helps in identifying what went wrong.
定义最终目标用于跟踪性能,而后者有助于识别出问题所在。
Essentially, we want to measure how an end-user is seeing our application, in other words, we aim at measuring end-users perception. Hence, tracking the final state of our application along with a series of visible changes.
本质上,我们要衡量最终用户如何看待我们的应用程序,换句话说,我们旨在衡量最终用户的感知。 因此,跟踪我们的应用程序的最终状态以及一系列可见的更改。
We can start with 🔗 FCP (First Contentful Paint) when the first time something gets painted on the screen and then track FMP (First Meaningful Paint) which measures when the primary content of a page is visible.
我们可以从something第一次在屏幕上绘制内容时开始使用FCP(第一内容绘画) ,然后跟踪测量页面主要内容何时可见的FMP(第一有意义绘画)。
Because of some challenges, now it’s recommended to use a more reliable metric called 🔗 LCP (Largest Contentful Paint) which marks the point on the page load timeline when the page’s main content has likely loaded.
由于某些挑战 ,现在建议使用一种更可靠的度量标准,称为🔗LCP (最大内容绘画) ,该度量标准在页面加载时间轴上标记页面主要内容可能已加载的时间点。
Note that LCP is not reliable when the page is loaded in the background, in such case LCP can be significantly higher than the actual value.
请注意,在后台加载页面时,LCP不可靠,在这种情况下,LCP可能会大大高于实际值。
记录自定义指标 (Logging custom metrics)
Although the above metrics tell us about the performance from the actual user point of view and we are able to measure end-users perception, we still lack the knowledge on the details in between and how to map this information to the actual code.
尽管以上指标从实际用户的角度告诉我们性能,并且能够衡量最终用户的感知,但我们仍然缺乏关于两者之间的详细信息以及如何将此信息映射到实际代码的知识。
To enhance debuggability and find what’s causing a performance regression, we can leverage User Timings API to mark custom metrics for major events during the load.
为了增强可调试性并查找导致性能下降的原因,我们可以利用User Timings API标记加载过程中主要事件的自定义指标。
By using user timings we can mark a timestamp and then later measure the duration from that event to the current time. The idea here is to log the duration of such major events that took place while rendering the final output.
通过使用用户计时,我们可以标记一个时间戳,然后再测量从该事件到当前时间的持续时间。 这里的想法是记录在渲染最终输出时发生的此类主要事件的持续时间。
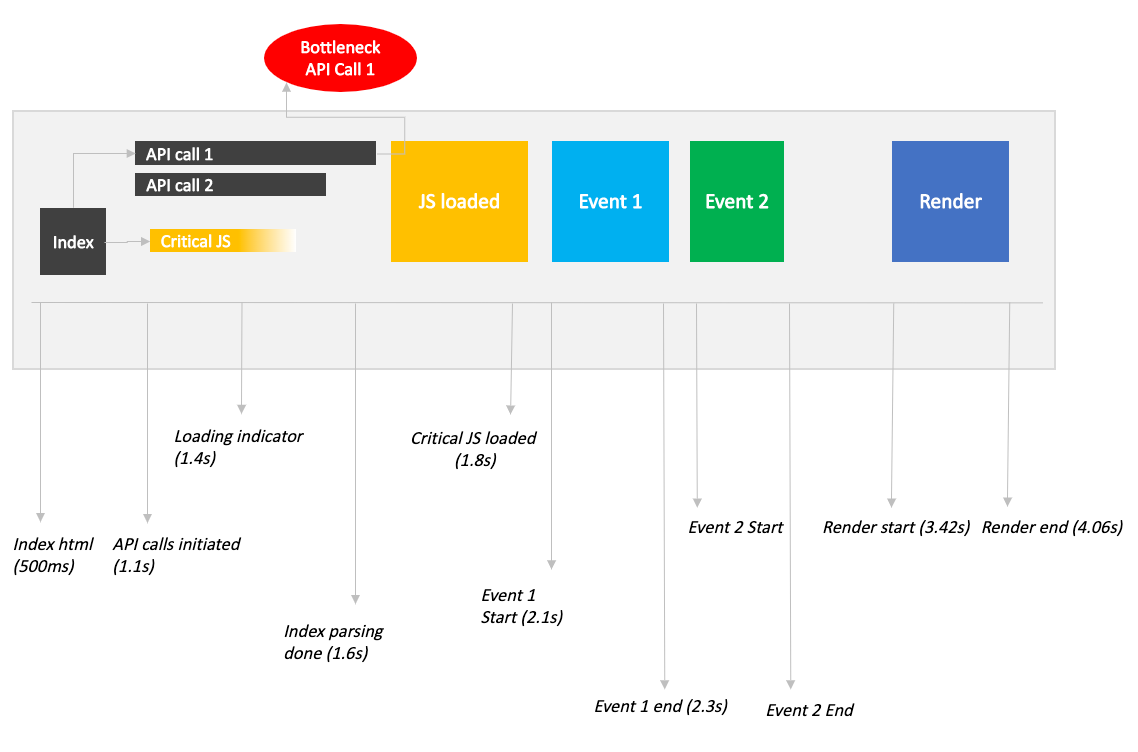
By tracking such a series of events that happen from the point when we first receive the HTML document to rendering the final view we’ll be able to identify what went wrong when investigating performance regressions later.
通过跟踪从我们最初收到HTML文档到呈现最终视图的那一刻发生的一系列事件,我们可以在以后研究性能下降时确定出了什么问题。
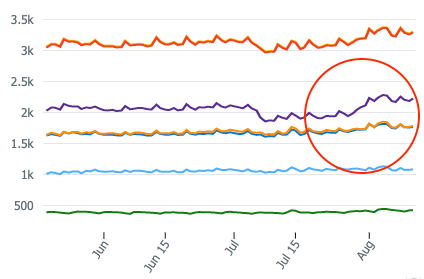
In the above sample, we can see that the original metric (red) has increased because of a shift in the purple metric, hence we can trace back to what could have caused a shift in the purple metric.
在上面的示例中,我们可以看到原始指标(红色)由于紫色指标的变化而增加,因此我们可以追溯到可能导致紫色指标变化的原因。
By simply logging the end goal it would have been difficult to identify this just by looking at the time series plot.
仅通过记录最终目标,仅通过查看时间序列图就很难识别出这一目标。
使用灯塔捕获自定义指标 (Capturing custom metrics with lighthouse)
Further, for analysis, these metrics can be logged in a synthetic environment like CI/CD, Cron Jobs, or using the local Chrome dev tools.
此外,为了进行分析,可以将这些指标记录在CI / CD,Cron Jobs等综合环境中,也可以使用本地Chrome开发工具进行记录。
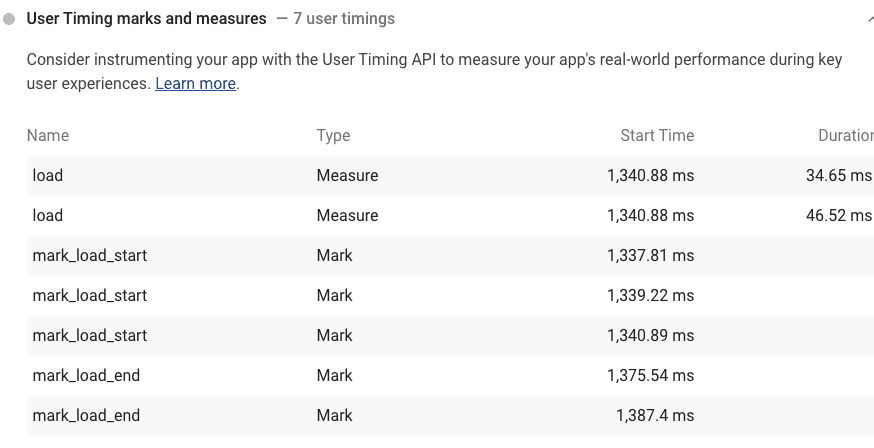
The Lighthouse tool shows the metrics logged by using marks and measures using the User Timings API in the User Timing section, it also generates these results as JSON data.
Lighthouse工具在“用户计时”部分中显示通过使用标记和度量使用“用户计时” API记录的指标,它还将这些结果生成为JSON数据。
结论 (Conclusion)
Identifying, fixing regressions, and maintaining a baseline is an ongoing process. We can efficiently monitor performance by understanding our users and selecting the most important profile based on either business importance, most impacted users, or the largest subset of users and defining an end goal for that profile, thereby observe trends and identify regressions.
识别,修复回归并维持基线是一个持续的过程。 我们可以通过了解我们的用户并根据业务重要性,受影响最大的用户或最大的用户子集选择最重要的配置文件,并定义该配置文件的最终目标,从而有效地监控性能,从而观察趋势并确定回归。
Triggering synthetic performance runs during the CI/CD phase helps us in validating the changes before pushing to the production. Having frequent runs in a controlled environment and observing the trend in these metrics can help in setting a realistic baseline and provides direction on improvements.
在CI / CD阶段触发合成性能运行有助于我们在进行生产之前验证更改。 在受控环境中进行频繁运行并观察这些指标的趋势可以帮助设置切合实际的基准并为改进提供指导。
Further, we can log important metrics through real user telemetry and understand how our business is impacted by variation in these metrics.
此外,我们可以通过真实的用户遥测记录重要指标,并了解这些指标的变化对我们的业务有何影响。
使用Bit共享和管理可重用JS组件 (Share & Manage Reusable JS Components with Bit)
Use Bit (Github) to share, document, and manage reusable components from different projects. It’s a great way to increase code reuse, speed up development, and build apps that scale.
使用Bit ( Github )共享,记录和管理来自不同项目的可重用组件。 这是增加代码重用,加速开发并构建可扩展应用程序的好方法。
Bit supports Node, TypeScript, React, Vue, Angular, and more.
Bit支持Node,TypeScript,React,Vue,Angular等。
下一步是什么? (What’s next?)
翻译自: https://blog.bitsrc.io/understanding-web-performance-monitoring-2ed52f97a974
web前端性能监控平台


 被折叠的 条评论
为什么被折叠?
被折叠的 条评论
为什么被折叠?
 到【灌水乐园】发言


