


 本文介绍如何使用Angular和D3.js库创建交互式的迷你图。通过详细步骤,包括安装D3.js、配置Angular组件和使用HostListener处理窗口调整大小事件,展示了如何将动态数据可视化集成到Angular应用程序中。
迷你5和迷你4区别
So you want to display a Sparkline? There’s no need to use bulky libraries, especially those built on top of D3 (don’t get me wrong, many of them are great), or pay for a commercial component here. We can make one fairly easily in order to bring otherwise boring numbers alive!
所以您想显示迷你图? 无需使用庞大的库,尤其是在D3之上构建的库(请不要误会,其中很多都是不错的),也不需要在这里购买商业组件。 我们可以很容易地制作一个,以使其他无聊的数字活起来!
To tackle this, we are going to use D3.js which is described on Wikipedia as:
为了解决这个问题,我们将使用 D3.js这是维基百科的描述为:
D3.js (also known as D3, short for Data-Driven Documents) is a JavaScript library for producing dynamic, interactive data visualizations in web browsers. It makes use of the widely implemented Scalable Vector Graphics (SVG), HTML5, and Cascading Style Sheets (CSS) standards.
D3.js(也称为D3,数据驱动文档的缩写)是一个JavaScript库,用于在Web浏览器中生成动态的交互式数据可视化。 它利用了广泛实施的可伸缩矢量图形(SVG),HTML5和级联样式表(CSS)标准。
先决条件 (Prerequisites)
Most Angular targeted tutorials that I see these days like to walk you through installing Angular and creating a brand new project. I’m not going to do that, for one I strongly believe you should have foundational knowledge of the framework before you get here. However, I will provide a link on how to get started with Angular, so if you’re new — go through the tutorial (Tour of Heroes) and then come back and make a Sparkline with us! Angular Tour of Heroes
我最近看到的大多数Angular目标教程都希望引导您完成Angular的安装并创建一个全新的项目。 我不会这样做,因为我坚信一个人在到达这里之前应该对框架有基础的了解。 但是,我将提供一个有关如何开始使用Angular的链接,因此,如果您是新手,请遍历教程(《英雄之旅》),然后再回来与我们一起制作Sparkline! 英雄角游
You will need to install the D3 library, which can be done at a prompt with: npm install d3 --save
您将需要安装D3库,可以在出现以下提示时完成npm install d3 --save : npm install d3 --save
Then, to ensure we do not go mad while implementing the awesomeness of D3, we need the typings: npm install @types/d3 --save-dev
然后,为确保在实现D3的出色表现时不会发疯,我们需要输入以下内容: npm install @types/d3 --save-dev
All right, we now have the libraries so let’s get moving on the data. When dealing with the data for D3, many of the examples on Observable HQ use csv or tsv data (comma or tab separated data, respectively). These are great, however most APIs tend to return JSON data, so we need to do some work to prepare it before we dive into the creation of the actual sparkline.
好了,我们现在有了库,让我们继续处理数据。 处理D3的数据时, Observable HQ上的许多示例都使用csv或tsv数据(分别为逗号或制表符分隔的数据)。 这些功能很棒,但是大多数API倾向于返回JSON数据,因此在深入研究实际迷你图之前,我们需要做一些准备工作。
tsconfig.json (tsconfig.json)
Before we move on, I like to use path shortcuts when building Angular apps. This way, I can access src/app/feature/demo/demo.component.ts simply with ~app/feature/demo/demo.component. To do this, you’ll want to open the tsconfig.json file in the root directory and add the following to the compilerOptions section, which I usually insert just below the moduleResolution and before the importHelpers.
在继续之前,我喜欢在构建Angular应用程序时使用路径快捷方式。 这样,我可以使用〜app / feature / demo / demo.component轻松访问src / app / feature / demo / demo.component.ts 。 为此,您需要在根目录中打开tsconfig.json文件,并将以下内容添加到editorOptions部分中,我通常将其插入到moduleResolution的下方和importHelpers的前面。
"paths": {
      "~app/*": ["src/app/*"],
      "~assets/*": ["src/assets/*"],
      "~environment/*": ["src/environments/*"]
},
图表模型 (Chart Model)
The Chart Model is what holds the structure to our data, and keeps us from fighting our chosen Typescript linter. Let’s create it with:
图表模型可以为我们的数据保留结构,并可以防止我们与所选的Typescript短毛绒打架。 让我们用以下命令创建它:
ng generate class feature/chart/chartThis should create a chart.ts file within the app/feature/chart directory . For this implementation, we only need to create a class called ‘ChartSeries’ which will hold the x and y axis data.
这应该在app / feature / chart目录中创建一个chart.ts文件。 对于此实现,我们只需要创建一个名为“ ChartSeries”的类即可容纳x和y轴数据。
ChartSeries
图表系列
xAxis — The x axis data
xAxis — x轴数据
yAxis — The y axis data
yAxis — y轴数据
Here is the full chart file:
这是完整的图表文件:
chart.ts
图表
export class ChartSeries {
    public xAxis: any;
    public yAxis: any;
}
图表组件 (Chart Component)
We need a component to actually display the sparkline. we will do that by generating a chart component with: ng generate component feature/chart
我们需要一个组件来实际显示迷你图。 我们将通过生成具有以下内容的图表组件来做到这一点: ng generate component feature/chart
Once it’s created, let’s open: app/feature/chart/chart.component.ts
创建完成后,让我们打开: app / feature / chart / chart.component.ts
chart.component.ts (chart.component.ts)
We’re going to utilize quite a few core Angular interfaces, including AfterViewInit, ElementRef, HostListener, Input, and ViewChild. We do this through an import. Replace the existing: import { Component, OnInit } from '@angular/core';
我们将利用很多核心Angular接口,包括AfterViewInit , ElementRef , HostListener , Input和ViewChild 。 我们通过导入来做到这一点。 替换现有的: import { Component, OnInit } from '@angular/core';
With: import { AfterViewInit, Component, ElementRef, HostListener, Input, ViewChild } from '@angular/core';
使用: import { AfterViewInit, Component, ElementRef, HostListener, Input, ViewChild } from '@angular/core';
Once that’s done, let’s import the D3 library: import * as d3 from 'd3';
完成后,让我们导入D3库: import * as d3 from 'd3';
Last but not least, the ChartSeries class that we created earlier: import { ChartSeries } from './chart';
最后但并非最不重要的一点是,我们之前创建的ChartSeries类: import { ChartSeries } from './chart';
Alright, that should set us up for success!
好吧,那应该使我们成功!
You’ll probably have an error here because we are implementing OnInit and not AfterViewInit, so we need to make two adjustments:
您可能会在这里出现错误,因为我们正在实现OnInit而不是AfterViewInit,因此我们需要进行两项调整:
Replace the export statement on what should be on or near line 10 that containsexport class ChartComponent implements OnInit {
在包含export class ChartComponent implements OnInit {
With export class ChartComponent implements AfterViewInit {
通过export class ChartComponent implements AfterViewInit {
We also need to replace the ngOnInit() method with ngAfterViewInit(). On or around line 14 replace ngOnInit(): void {}
我们还需要与ngAfterViewInit更换ngOnInit()()方法。 在第14行或其周围替换ngOnInit(): void {}
With ngAfterViewInit(): void {}
使用ngAfterViewInit(): void {}
Why is this important? If you aren’t super familiar with the Angular Component Lifecycle it is essentially a way to ‘inject’ your code into the component at specific events in the lifecycle of the component (creation, updates, and destruction). From the official Angular documentation:
为什么这很重要? 如果您对Angular组件的生命周期不太熟悉,那么这实际上是一种在组件的生命周期中的特定事件(创建,更新和销毁)上将代码“注入”到组件中的方法。 从Angular官方文档中:
A component instance has a lifecycle that starts when Angular instantiates the component class and renders the component view along with its child views. The lifecycle continues with change detection, as Angular checks to see when data-bound properties change, and updates both the view and the component instance as needed. The lifecycle ends when Angular destroys the component instance and removes its rendered template from the DOM. Directives have a similar lifecycle, as Angular creates, updates, and destroys instances in the course of execution.
组件实例的生命周期从Angular实例化组件类并渲染组件视图及其子视图时开始。 生命周期将继续进行更改检测,因为Angular会检查数据绑定属性何时更改,并根据需要更新视图和组件实例。 当Angular销毁组件实例并从DOM中删除其呈现的模板时,生命周期结束。 指令具有相似的生命周期,因为Angular在执行过程中会创建,更新和销毁实例。
Therefore, we want to wait until the component is as initialized as it can be before attempting to draw anything. This is especially important as we will be utilizing the ViewChild decorator which per the Angular documentation is set just before ngAfterViewInit() is called, but after other initialization lifecycle hooks.
因此,在尝试绘制任何内容之前,我们要等到组件被尽可能初始化为止。 这一点尤其重要,因为我们将利用ViewChild装饰器,该装饰器在ngAfterViewInit()调用之前,但在其他初始化生命周期挂钩之后,将根据Angular文档进行设置。
View queries are set before the
ngAfterViewInitcallback is called.视图查询是在调用
ngAfterViewInit回调之前设置的。
Host ListenerAlright! Now we also want to make sure that when the window is resized, our chart is sized with it. We want to capture any window resize events to re-draw our chart appropriately within its container. The easiest way to do this is via an Angular HostListener — we capture any ‘window:resize’ event and then execute our re-draw method of this.resize() which we will implement further on in this article.
主持人监听器好! 现在,我们还想确保在调整窗口大小时,图表也随之调整大小。 我们想要捕获任何窗口调整大小事件,以在其容器中适当地绘制图表。 最简单的方法是通过Angular HostListener-我们捕获任何' window:resize '事件,然后执行this.resize()的 re-draw方法,该方法将在本文中进一步实现。
@HostListener('window:resize', ['$event'])
onResize() {
    this.resize();
}InputWe will also need a few pieces of information from the calling component to initialize the chart and to size things properly.
输入我们还将需要调用组件提供的一些信息,以初始化图表并适当调整大小。
@Input() data: ChartSeries[]; // The data to plot on the sparkline
@Input() lineColor: number[] = [70, 130, 180, 1]; // The RGBA value representing the color of the sparkline
@Input() margin: number = 0; // The margin to apply to sizing calculations - default to 0 but will typically be 20-24 pixels.
Keep in mind that if you don’t want to use RGBA values, you can simply make lineColor a string and utilize the HEX code such as ‘#4682B4’ but I like to allow myself the freedom of opacity (the fourth number in the RGBA array that can range between 0 — completely transparent and 1-no transparency, such as 0.4)
请记住,如果您不想使用RGBA值,则可以简单地将lineColor设置为字符串并使用十六进制代码(例如“ #4682B4”),但我想允许自己具有不透明性(RGBA中的第四个数字)数组,范围为0-完全透明和1-不透明,例如0.4)
View Child
查看孩子
Moving right along! We will also want to utilize Angular’s ViewChild to easily (and without generating or requiring a specific element id which can get very troublesome when displaying multiple charts) refer to the container and chart DOM elements.
继续前进! 我们还将希望利用Angular的ViewChild轻松地(并且无需生成或要求特定的元素ID(在显示多个图表时可能会非常麻烦))来引用容器和图表DOM元素。
@ViewChild('chart', {static: false}) chart: ElementRef<SVGElement>;
@ViewChild('container', {static: false}) container: ElementRef<HTMLDivElement>;
Other VariablesFinally, we need to store a few global values to use throughout our component such as height, width, and a global svg component to reference later.
其他变量最后,我们需要存储一些全局值以在整个组件中使用,例如高度,宽度和一个全局svg组件,以供以后参考。
private height: number;
private svg: any;
private width: number;
快速回顾 (Quick Recap)
As of right now, our chart.component.ts file should look very similar to this:
截至目前,我们的chart.component.ts文件应与以下内容非常相似:
import { AfterViewInit, Component, ElementRef, HostListener, Input, ViewChild } from '@angular/core';
import * as d3 from 'd3';
import { ChartSeries } from './chart';@Component({
    selector: 'app-chart',
    templateUrl: './chart.component.html',
    styleUrls: ['./chart.component.scss']
})
export class ChartComponent implements AfterViewInit {    @HostListener('window:resize', ['$event'])
    onResize() {
        this.resize();
    }
    @Input() data: ChartSeries[] = []; // The data to plot on the sparkline
    @Input() lineColor: number[] = [70, 130, 180, 1]; // The RGBA value representing the color of the sparkline
    @Input() margin: number = 0; // The margin to apply to sizing calculations - default to 0 but will typically be 20-24 pixels.    @ViewChild('chart', {static: false}) chart: ElementRef<SVGElement>;
    @ViewChild('container', {static: false}) container: ElementRef<HTMLDivElement>;    private height: number;
    private svg: any;
    private width: number;    constructor() { }    ngAfterViewInit(): void {
    }
}
调整大小 (resize)
The first method we want to implement is resize. This will allow us to modify our chart height and width any time a resize event is triggered, and it will allow us to perform initial size setup. We will use our ViewChild definitions of this.container and this.chart — and then access their nativeElement properties.
我们要实现的第一种方法是调整大小。 这将允许我们在触发调整大小事件时随时更改图表的高度和宽度,并允许我们执行初始大小设置。 我们将使用this.container和this.chart的 ViewChild定义-然后访问其nativeElement属性。
private resize(): void {
    // We know how big we should be based on our parent element - and its offsetHeight/offsetWidth properties
    this.height = this.container.nativeElement.parentElement.offsetHeight;
    this.width = this.container.nativeElement.parentElement.offsetWidth;    this.chart.nativeElement.style.height = `${this.height}px`;
    this.chart.nativeElement.style.maxHeight = `${this.height}px`;
    this.chart.nativeElement.style.maxWidth = `${this.width}px`;
    this.chart.nativeElement.style.minHeight = `${this.height}px`;
    this.chart.nativeElement.style.minWidth = `${this.width}px`;
    this.chart.nativeElement.style.width = `${this.width}px`;    this.container.nativeElement.style.height = `${this.height}px`;
    this.container.nativeElement.style.maxHeight = `${this.height}px`;
    this.container.nativeElement.style.maxWidth = `${this.width}px`;
    this.container.nativeElement.style.minHeight = `${this.height}px`;
    this.container.nativeElement.style.minWidth = `${this.width}px`;
    this.container.nativeElement.style.width = `${this.width}px`;
}
Now that we have our resize event, let’s add it to our ngAfterViewInit method to set our height and width on initialization. In addition, let’s make it easer to reference our actual chart later on with a d3.select().
现在我们有了resize事件,让我们将其添加到ngAfterViewInit方法中以设置初始化时的高度和宽度。 另外,让我们稍后使用d3.select()来更轻松地引用我们的实际图表。
ngAfterViewInit(): void {
    this.resize();
    this.svg = d3.select(this.chart.nativeElement);
}
buildSparkline (buildSparkline)
Now we’re on to the real meat of the thing. We need to generate and draw our sparkline.
现在,我们开始探讨事物的实质。 我们需要生成并绘制我们的迷你图。
X and Y scalesScales allow d3 to scale data along an axis. Per the d3 documentation:
X和Y标度标度允许d3沿轴标度数据。 根据d3文档:
Scale functions are JavaScript functions that:
Scale函数是以下JavaScript函数:
- take an input (usually a number, date or category) and- return a value (such as a coordinate, a colour, a length or a radius)
-输入(通常是数字,日期或类别)并返回值(例如坐标,颜色,长度或半径)
They’re typically used to transform (or ‘map’) data values into visual variables (such as position, length and colour).
它们通常用于将数据值转换(或“映射”)为可视变量(例如位置,长度和颜色)。
We’re going to assume that our x axis is time (the axis that runs horizontally — e.g. left<->right) and that our y axis is a numeric value (the axis that runs vertically — e.g. top<->bottom). We start at a range of zero for the x axis (left most value) and end with the width of the component. On the y axis we start at a range of the height of the component (bottom most value) and end with 0. With the domains, we use d3.extent() to determine the minimum and maximum range of time within this.data on the x axis — for the y axis we have a domain that starts at zero and ends at the maximum value in this.data’s yAxis.
我们将假设我们的x轴是时间(水平方向运行的轴,例如left <-> right),而我们的y轴是数值(垂直方向运行的轴,例如top <-> bottom)。 我们从x轴的零范围开始(最左边的值),以组件的宽度结束。 在y轴上,我们从组件的高度范围(最底端的值)开始,以0结尾。对于域,我们使用d3.extent()来确定this.data上的最小和最大时间范围。 x轴-对于y轴,我们有一个从0开始并在this.data的yAxis的最大值处结束的域 。
const xScale = d3.scaleTime()
    .domain(d3.extent(this.data, (d) => d.xAxis))
    .range([0, this.width]);
const yScale = d3.scaleLinear()
    .domain([0, d3.max(this.data, (d) => d.yAxis)])
.range([this.height, 0]);LineYes, this is the actual sparkline. we simply create a d3.line and set its x and y axis’ to the return of the xScale and yScale methods respectively. We also set a nice curve to the line (instead of a jagged edge) with the d3.line curve method using d3.curveCardinal.
行是,这是实际的迷你图。 我们只需创建一个d3.line并将其x和y轴分别设置为xScale和yScale方法的返回值即可 。 我们还使用d3.curveCardinal的d3.line 曲线方法为该线(而不是锯齿状的边缘)设置了一条漂亮的曲线。
const line: any = d3.line<ChartSeries>()
      .curve(d3.curveCardinal)
      .x((d) => xScale(d.xAxis))
      .y((d) => yScale(d.yAxis));
Draw itNow we write our line to an SVG path to draw the sparkline on the canvas.
绘制线条现在,我们将线条写入SVG路径,以在画布上绘制迷你图。
this.svg.append('path')
      .datum(this.data)
      .attr('d', line)
      .style('fill', 'none')
      .style('stroke', `rgba(${this.lineColor[0]},${this.lineColor[1]},${this.lineColor[2]},${this.lineColor[3]})`)
      .style('stroke-width', '2')
      .style('width', `${this.width}px`);
Initialize itWe’ve gotten our handler for window resized and our SVG write for our sparkline — so we can initialize everything in ngAfterViewInit()
初始化它我们已经获得了调整窗口大小的处理程序和我们的迷你图的 SVG编写-因此我们可以在ngAfterViewInit()中初始化所有内容
ngAfterViewInit(): void {
    this.resize();
    this.svg = d3.select(this.chart.nativeElement);
    this.buildSparkline();
}
Wrap upAfter all of that fun, we should wind up with a chart.component.ts file that looks just like this:
总结了所有的乐趣后,我们应风与一个chart.component.ts文件看起来就像这样:
import { AfterViewInit, Component, ElementRef, HostListener, Input, ViewChild } from '@angular/core';
import * as d3 from 'd3';
import { ChartSeries } from './chart';@Component({
  selector: 'app-chart',
  templateUrl: './chart.component.html',
  styleUrls: ['./chart.component.scss']
})
export class ChartComponent implements AfterViewInit {    @HostListener('window:resize', ['$event'])
    onResize() {
      this.resize();
    }    @Input() data: ChartSeries[]; // The data to plot on the sparkline
    @Input() lineColor: number[] = [70, 130, 180, 1]; // The RGBA value representing the color of the sparkline
    @Input() margin: number = 0; // The margin to apply to sizing calculations - default to 0 but will typically be 20-24 pixels.    @ViewChild('chart', {static: false}) chart: ElementRef<SVGElement>;
    @ViewChild('container', {static: false}) container: ElementRef<HTMLDivElement>;    private height: number;
    private svg: any;
    private width: number;    constructor() { }    ngAfterViewInit(): void {
        this.resize();
        this.svg = d3.select(this.chart.nativeElement);
        this.buildSparkline();
      }    private buildSparkline(): void {        const xScale: any = d3.scaleTime()
          .domain(d3.extent(this.data, (d) => d.xAxis))
          .range([0, this.width]);        const yScale: any = d3.scaleLinear()
          .domain([0, d3.max(this.data, (d) => d.yAxis)])
          .range([this.height, 0]);        const line: any = d3.line<ChartSeries>()
          .curve(d3.curveCardinal)
          .x((d) => xScale(d.xAxis))
          .y((d) => yScale(d.yAxis));        this.svg.append('path')
          .datum(this.data)
          .attr('d', line)
          .style('fill', 'none')
          .style('stroke', `rgba(${this.lineColor[0]},${this.lineColor[1]},${this.lineColor[2]},${this.lineColor[3]})`)
          .style('stroke-width', '2')
          .style('width', `${this.width}px`);
    }    private resize(): void {
        // We know how big we should be based on our parent element - and its offsetHeight/offsetWidth properties
        this.height = this.container.nativeElement.parentElement.offsetHeight;
        this.width = this.container.nativeElement.parentElement.offsetWidth;        this.chart.nativeElement.style.height = `${this.height}px`;
        this.chart.nativeElement.style.maxHeight = `${this.height}px`;
        this.chart.nativeElement.style.maxWidth = `${this.width}px`;
        this.chart.nativeElement.style.minHeight = `${this.height}px`;
        this.chart.nativeElement.style.minWidth = `${this.width}px`;
        this.chart.nativeElement.style.width = `${this.width}px`;this.container.nativeElement.style.height = `${this.height}px`;
        this.container.nativeElement.style.maxHeight = `${this.height}px`;
        this.container.nativeElement.style.maxWidth = `${this.width}px`;
        this.container.nativeElement.style.minHeight = `${this.height}px`;
        this.container.nativeElement.style.minWidth = `${this.width}px`;
        this.container.nativeElement.style.width = `${this.width}px`;
    }
}
chart.component.html (chart.component.html)
Our component is great, but we’re not showing anything yet. Let’s do a quick replacement in chart.component.html of the placeholder from Angular with the following:
我们的组件很棒,但是还没有显示任何东西。 让我们在Angular中占位符的chart.component.html中快速替换为以下内容:
<div #container style="height: 100%; width: 100%;">
  <svg #chart height="100%" style="overflow: visible;" width="100%">
  </svg>
</div>
You should recognize the #container and #chart identifiers above — these are what we reference with ViewChild in chart.component.ts
您应该认识到上面的#container和#chart标识符-这些是我们在chart.component.ts中使用ViewChild引用的内容
演示组件 (Demo Component)
The Chart component is now finished, but we’re not using it. Let’s create a new component with the purpose of using it.ng generate component feature/demo
图表组件现已完成,但我们没有使用它。 让我们创建一个新组件来使用它。 ng generate component feature/demo
数据 (data.ts)
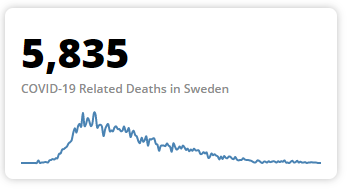
To load this component up, we need some data. Let’s create a file (do this manually, without the Angular CLI) called ‘data.ts’ in the app/feature/demo directory. We’re going to use static data here, but it could just as easily be brought in from an external source. That is outside the scope of this particular article, so we’re using static data for now. Here, i’m using the latest (as of the time of this writing) daily COVID-19 fatality data from Sweden. Feel free to use any x and y axis you choose!
要加载此组件,我们需要一些数据。 让我们在app / feature / demo目录中创建一个名为“ data.ts ”的文件(手动操作,无需Angular CLI)。 我们将在这里使用静态数据,但也可以从外部来源轻松地将其引入。 这不在本文的讨论范围之内,因此我们现在正在使用静态数据。 在这里,我使用的是瑞典(截至撰写本文时)的最新每日COVID-19死亡率数据。 随意使用您选择的任何x和y轴!
import { ChartSeries } from '~app/feature/chart/chart';export const DATA: ChartSeries[] = [{xAxis: new Date('3/01/2020'), yAxis: 0},{xAxis: new Date('3/02/2020'), yAxis: 0},{xAxis: new Date('3/03/2020'), yAxis: 0},{xAxis: new Date('3/04/2020'), yAxis: 0},{xAxis: new Date('3/05/2020'), yAxis: 0},{xAxis: new Date('3/06/2020'), yAxis: 0},{xAxis: new Date('3/07/2020'), yAxis: 0},{xAxis: new Date('3/08/2020'), yAxis: 0},{xAxis: new Date('3/09/2020'), yAxis: 0},{xAxis: new Date('3/10/2020'), yAxis: 0},{xAxis: new Date('3/11/2020'), yAxis: 0},{xAxis: new Date('3/12/2020'), yAxis: 6},{xAxis: new Date('3/13/2020'), yAxis: 0},{xAxis: new Date('3/14/2020'), yAxis: 1},{xAxis: new Date('3/15/2020'), yAxis: 1},{xAxis: new Date('3/16/2020'), yAxis: 2},{xAxis: new Date('3/17/2020'), yAxis: 2},{xAxis: new Date('3/18/2020'), yAxis: 1},{xAxis: new Date('3/19/2020'), yAxis: 6},{xAxis: new Date('3/20/2020'), yAxis: 7},{xAxis: new Date('3/21/2020'), yAxis: 9},{xAxis: new Date('3/22/2020'), yAxis: 8},{xAxis: new Date('3/23/2020'), yAxis: 11},{xAxis: new Date('3/24/2020'), yAxis: 11},{xAxis: new Date('3/25/2020'), yAxis: 21},{xAxis: new Date('3/26/2020'), yAxis: 22},{xAxis: new Date('3/27/2020'), yAxis: 31},{xAxis: new Date('3/28/2020'), yAxis: 32},{xAxis: new Date('3/29/2020'), yAxis: 35},{xAxis: new Date('3/30/2020'), yAxis: 38},{xAxis: new Date('3/31/2020'), yAxis: 45},{xAxis: new Date('4/01/2020'), yAxis: 48},{xAxis: new Date('4/02/2020'), yAxis: 53},{xAxis: new Date('4/03/2020'), yAxis: 70},{xAxis: new Date('4/04/2020'), yAxis: 80},{xAxis: new Date('4/05/2020'), yAxis: 70},{xAxis: new Date('4/06/2020'), yAxis: 85},{xAxis: new Date('4/07/2020'), yAxis: 90},{xAxis: new Date('4/08/2020'), yAxis: 84},{xAxis: new Date('4/09/2020'), yAxis: 115},{xAxis: new Date('4/10/2020'), yAxis: 86},{xAxis: new Date('4/11/2020'), yAxis: 90},{xAxis: new Date('4/12/2020'), yAxis: 103},{xAxis: new Date('4/13/2020'), yAxis: 97},{xAxis: new Date('4/14/2020'), yAxis: 85},{xAxis: new Date('4/15/2020'), yAxis: 91},{xAxis: new Date('4/16/2020'), yAxis: 115},{xAxis: new Date('4/17/2020'), yAxis: 111},{xAxis: new Date('4/18/2020'), yAxis: 82},{xAxis: new Date('4/19/2020'), yAxis: 86},{xAxis: new Date('4/20/2020'), yAxis: 88},{xAxis: new Date('4/21/2020'), yAxis: 84},{xAxis: new Date('4/22/2020'), yAxis: 62},{xAxis: new Date('4/23/2020'), yAxis: 77},{xAxis: new Date('4/24/2020'), yAxis: 86},{xAxis: new Date('4/25/2020'), yAxis: 89},{xAxis: new Date('4/26/2020'), yAxis: 73},{xAxis: new Date('4/27/2020'), yAxis: 75},{xAxis: new Date('4/28/2020'), yAxis: 73},{xAxis: new Date('4/29/2020'), yAxis: 82},{xAxis: new Date('4/30/2020'), yAxis: 84},{xAxis: new Date('5/01/2020'), yAxis: 78},{xAxis: new Date('5/02/2020'), yAxis: 78},{xAxis: new Date('5/03/2020'), yAxis: 73},{xAxis: new Date('5/04/2020'), yAxis: 75},{xAxis: new Date('5/05/2020'), yAxis: 84},{xAxis: new Date('5/06/2020'), yAxis: 72},{xAxis: new Date('5/07/2020'), yAxis: 73},{xAxis: new Date('5/08/2020'), yAxis: 80},{xAxis: new Date('5/09/2020'), yAxis: 60},{xAxis: new Date('5/10/2020'), yAxis: 69},{xAxis: new Date('5/11/2020'), yAxis: 74},{xAxis: new Date('5/12/2020'), yAxis: 64},{xAxis: new Date('5/13/2020'), yAxis: 61},{xAxis: new Date('5/14/2020'), yAxis: 50},{xAxis: new Date('5/15/2020'), yAxis: 46},{xAxis: new Date('5/16/2020'), yAxis: 58},{xAxis: new Date('5/17/2020'), yAxis: 49},{xAxis: new Date('5/18/2020'), yAxis: 53},{xAxis: new Date('5/19/2020'), yAxis: 61},{xAxis: new Date('5/20/2020'), yAxis: 40},{xAxis: new Date('5/21/2020'), yAxis: 54},{xAxis: new Date('5/22/2020'), yAxis: 54},{xAxis: new Date('5/23/2020'), yAxis: 56},{xAxis: new Date('5/24/2020'), yAxis: 56},{xAxis: new Date('5/25/2020'), yAxis: 44},{xAxis: new Date('5/26/2020'), yAxis: 42},{xAxis: new Date('5/27/2020'), yAxis: 28},{xAxis: new Date('5/28/2020'), yAxis: 39},{xAxis: new Date('5/29/2020'), yAxis: 40},{xAxis: new Date('5/30/2020'), yAxis: 40},{xAxis: new Date('5/31/2020'), yAxis: 39},{xAxis: new Date('6/01/2020'), yAxis: 45},{xAxis: new Date('6/02/2020'), yAxis: 40},{xAxis: new Date('6/03/2020'), yAxis: 37},{xAxis: new Date('6/04/2020'), yAxis: 26},{xAxis: new Date('6/05/2020'), yAxis: 45},{xAxis: new Date('6/06/2020'), yAxis: 38},{xAxis: new Date('6/07/2020'), yAxis: 31},{xAxis: new Date('6/08/2020'), yAxis: 33},{xAxis: new Date('6/09/2020'), yAxis: 38},{xAxis: new Date('6/10/2020'), yAxis: 33},{xAxis: new Date('6/11/2020'), yAxis: 40},{xAxis: new Date('6/12/2020'), yAxis: 36},{xAxis: new Date('6/13/2020'), yAxis: 30},{xAxis: new Date('6/14/2020'), yAxis: 33},{xAxis: new Date('6/15/2020'), yAxis: 27},{xAxis: new Date('6/16/2020'), yAxis: 31},{xAxis: new Date('6/17/2020'), yAxis: 28},{xAxis: new Date('6/18/2020'), yAxis: 33},{xAxis: new Date('6/19/2020'), yAxis: 29},{xAxis: new Date('6/20/2020'), yAxis: 29},{xAxis: new Date('6/21/2020'), yAxis: 29},{xAxis: new Date('6/22/2020'), yAxis: 21},{xAxis: new Date('6/23/2020'), yAxis: 21},{xAxis: new Date('6/24/2020'), yAxis: 25},{xAxis: new Date('6/25/2020'), yAxis: 22},{xAxis: new Date('6/26/2020'), yAxis: 24},{xAxis: new Date('6/27/2020'), yAxis: 12},{xAxis: new Date('6/28/2020'), yAxis: 14},{xAxis: new Date('6/29/2020'), yAxis: 22},{xAxis: new Date('6/30/2020'), yAxis: 18},{xAxis: new Date('7/01/2020'), yAxis: 20},{xAxis: new Date('7/02/2020'), yAxis: 17},{xAxis: new Date('7/03/2020'), yAxis: 15},{xAxis: new Date('7/04/2020'), yAxis: 8},{xAxis: new Date('7/05/2020'), yAxis: 15},{xAxis: new Date('7/06/2020'), yAxis: 9},{xAxis: new Date('7/07/2020'), yAxis: 16},{xAxis: new Date('7/08/2020'), yAxis: 12},{xAxis: new Date('7/09/2020'), yAxis: 11},{xAxis: new Date('7/10/2020'), yAxis: 15},{xAxis: new Date('7/11/2020'), yAxis: 14},{xAxis: new Date('7/12/2020'), yAxis: 10},{xAxis: new Date('7/13/2020'), yAxis: 9},{xAxis: new Date('7/14/2020'), yAxis: 14},{xAxis: new Date('7/15/2020'), yAxis: 8},{xAxis: new Date('7/16/2020'), yAxis: 6},{xAxis: new Date('7/17/2020'), yAxis: 7},{xAxis: new Date('7/18/2020'), yAxis: 7},{xAxis: new Date('7/19/2020'), yAxis: 11},{xAxis: new Date('7/20/2020'), yAxis: 8},{xAxis: new Date('7/21/2020'), yAxis: 7},{xAxis: new Date('7/22/2020'), yAxis: 7},{xAxis: new Date('7/23/2020'), yAxis: 6},{xAxis: new Date('7/24/2020'), yAxis: 5},{xAxis: new Date('7/25/2020'), yAxis: 3},{xAxis: new Date('7/26/2020'), yAxis: 1},{xAxis: new Date('7/27/2020'), yAxis: 2},{xAxis: new Date('7/28/2020'), yAxis: 6},{xAxis: new Date('7/29/2020'), yAxis: 5},{xAxis: new Date('7/30/2020'), yAxis: 2},{xAxis: new Date('7/31/2020'), yAxis: 0},{xAxis: new Date('8/01/2020'), yAxis: 3},{xAxis: new Date('8/02/2020'), yAxis: 3},{xAxis: new Date('8/03/2020'), yAxis: 1},{xAxis: new Date('8/04/2020'), yAxis: 4},{xAxis: new Date('8/05/2020'), yAxis: 2},{xAxis: new Date('8/06/2020'), yAxis: 3},{xAxis: new Date('8/07/2020'), yAxis: 4},{xAxis: new Date('8/08/2020'), yAxis: 3},{xAxis: new Date('8/09/2020'), yAxis: 1},{xAxis: new Date('8/10/2020'), yAxis: 4},{xAxis: new Date('8/11/2020'), yAxis: 2},{xAxis: new Date('8/12/2020'), yAxis: 4},{xAxis: new Date('8/13/2020'), yAxis: 3},{xAxis: new Date('8/14/2020'), yAxis: 6},{xAxis: new Date('8/15/2020'), yAxis: 1},{xAxis: new Date('8/16/2020'), yAxis: 1},{xAxis: new Date('8/17/2020'), yAxis: 0},{xAxis: new Date('8/18/2020'), yAxis: 3},{xAxis: new Date('8/19/2020'), yAxis: 5},{xAxis: new Date('8/20/2020'), yAxis: 1},{xAxis: new Date('8/21/2020'), yAxis: 2},{xAxis: new Date('8/22/2020'), yAxis: 5},{xAxis: new Date('8/23/2020'), yAxis: 1},{xAxis: new Date('8/24/2020'), yAxis: 3},{xAxis: new Date('8/25/2020'), yAxis: 1},{xAxis: new Date('8/26/2020'), yAxis: 1},{xAxis: new Date('8/27/2020'), yAxis: 2},{xAxis: new Date('8/28/2020'), yAxis: 0},{xAxis: new Date('8/29/2020'), yAxis: 1},{xAxis: new Date('8/30/2020'), yAxis: 1},{xAxis: new Date('8/31/2020'), yAxis: 2},{xAxis: new Date('9/01/2020'), yAxis: 1},{xAxis: new Date('9/02/2020'), yAxis: 1},{xAxis: new Date('9/03/2020'), yAxis: 1},{xAxis: new Date('9/04/2020'), yAxis: 0},{xAxis: new Date('9/05/2020'), yAxis: 0},{xAxis: new Date('9/06/2020'), yAxis: 0}
];
demo.component.ts (demo.component.ts)
We only need to pull in the DATA from data.ts and then make it accessible to our demo.component.html file which actually calls our chart component. Open demo.component.ts and replace the content with the following:
我们只需要从data.ts中提取DATA,然后使其可以访问我们的demo.component.html文件,该文件实际上调用了我们的图表组件。 打开demo.component.ts并将内容替换为以下内容:
import { Component, OnInit } from '@angular/core';
import { ChartSeries } from '~app/feature/chart/chart';
import { DATA } from './data';@Component({
  selector: 'app-demo',
  templateUrl: './demo.component.html',
  styleUrls: ['./demo.component.scss']
})
export class DemoComponent implements OnInit {    public data: ChartSeries[] = DATA;    constructor() { }    ngOnInit(): void {}}
demo.component.html (demo.component.html)
Let’s display the sparkline now. We’ll wrap it in a few DIVs to make it stand out. We will style these in the next section. Notice how we are sending [data]=”data” to the app-chart component.
现在显示迷你图。 我们将其包装在几个DIV中以使其脱颖而出。 我们将在下一部分中为这些样式设置样式。 注意我们如何将[data] =“ data”发送到应用程序图表组件。
<div class="card">
  <div class="card-content">
    <h1>5,835</h1>
    <h4 class="color-grey">COVID-19 Related Deaths in Sweden</h4>
  </div>
  <div class="card-footer">
    <div class="sparkline-wrapper">
      <app-chart [data]="data"></app-chart>
    </div>
  </div>
</div>
款式 (Styles)
All of this work is great, but unless it’s somewhat appealing to the eye — why are we here? Am I right? Let’s open up the styles.scss file in the root of the src directory.
所有这些工作都很棒,但是除非在某种程度上吸引人,否则我们为什么在这里? 我对吗? 让我们在src目录的根目录中打开styles.scss文件。
@import url('https://fonts.googleapis.com/css2?family=Open+Sans:wght@400;600;800&display=swap');:root {
  font-family: 'Open Sans', sans-serif;
  font-size: 12px;
}h1, h2, h3, h4, h5, h6 {
  margin: 0px;
  padding: 0px;
}h1 {
  font-size: 3.4em;
}h4 {
  font-weight: 600;
}.card {
  align-content: flex-start;
  align-items: flex-start;
  border-radius: 8px;
  box-shadow: 0 0 8px 0 rgba(40, 40, 40, .3);
  display: flex;
  flex: 1 0 300px;
  flex-flow: row wrap;
  height: auto;
  justify-content: flex-start;
  padding: 16px;
  position: relative;
  width: 300px;
}.card-content {
  width: 100%;
}.card-footer {
  margin-top: 16px;
  width: 100%;
}.color-grey {
  color: rgba(140, 140, 140, 1);
}.sparkline-wrapper {
  align-self: flex-end;
  display: flex;
  height: 50px;
  min-height: 50px;
  width: 100%;
}
应用程式 (App)
To finish up, we need to set up a few more items like styling and routing (so we can get to our demo component).
最后,我们需要设置一些其他项目,例如样式和路由(以便我们可以进入演示组件)。
app-routing.module.ts (app-routing.module.ts)
Let’s open our app-routing.module.ts file located at app/app-routing.module.ts and set up our route and default to the demo component. Routing is outside the scope of this article, so I would recommend a read on the Angular Router if you are unsure of what is happening here.
让我们打开位于app / app-routing.module.ts的 app-routing.module.ts文件,并设置路由并默认使用演示组件。 路由不在本文讨论范围之内,因此,如果不确定此处发生的情况,建议您阅读Angular Router。
import { NgModule } from '@angular/core';
import { Routes, RouterModule } from '@angular/router';import { DemoComponent } from '~app/feature/demo/demo.component';const routes: Routes = [
  {
    path: '',
    pathMatch: 'full',
    redirectTo: 'demo',
  },
  {
    component: DemoComponent,
    path: 'demo'
  }
];@NgModule({
  imports: [RouterModule.forRoot(routes)],
  exports: [RouterModule]
})
export class AppRoutingModule { }
app.component.html (app.component.html)
We’re going to clear out all the nonsense in our app/app.component.html file and replace it with a simple one liner. No really, this is all we want in this file.
我们将清除app / app.component.html文件中的所有废话,并用一个简单的衬里替换它。 真的不行,这就是我们在此文件中想要的全部。
<router-outlet></router-outlet>完成的产品 (Finished Product)
If all has gone well, you’ll see a beautiful little card with a sparkline when you load your app (typically http://localhost:4200).
如果一切顺利,则在加载应用程序时(通常为http:// localhost:4200 ) ,您会看到漂亮的小卡片,上面有一个迷你图。
Git存储库 (Git Repository)
You can access the full project at github here: https://github.com/johnathanesanders/angular-d3-sparkline
您可以在github上访问完整的项目: https : //github.com/johnathanesanders/angular-d3-sparkline
Thanks for reading!
谢谢阅读!
Tablet with charts photo by PhotoMIX Company from Pexels
带有图表的平板电脑, 来自 Pexels, 由 PhotoMIX Company 摄影
翻译自: https://medium.com/@johnathanesanders/sparklines-with-angular-and-d3-d279dbac0c38
迷你5和迷你4区别


 被折叠的 条评论
为什么被折叠?
被折叠的 条评论
为什么被折叠?
 到【灌水乐园】发言


