


 本文介绍了作者在Google Summer of Code 2020项目中,为TARDIS开发的LineInfoWidget。该工具旨在简化超新星模型的探索,通过在光谱图上选择波长范围,用户可以识别产生特定光谱特征的化学元素和线相互作用,从而加深对超新星爆炸机制的理解。
gsoc 任务
在上一集 (On the Previous Episode)
In my last article in this series, I told you that I was developing a prototype for Line Info Widget as a part of my three-month GSoC project at TARDIS (i.e. to develop a GUI as Jupyter widgets for making the exploration of Supernova models easier). The Line Info Widget gives Astrophysicists information about the atomic lines with which light packets interact before escaping Supernova.
在本系列的最后一篇文章中,我告诉您,我正在为TARDIS进行的为期三个月的GSoC项目的一部分,开发了Line Info Widget的原型(即,开发一个Jupyter Widgets图形用户界面来简化对Supernova模型的探索)。 )。 “行信息”小部件为天体物理学家提供有关逃逸超新星之前光包与之相互作用的原子线的信息。
I also explained to you how amazingly TARDIS constructs a spectrum from the information contained in hundred-thousands of light packets coming out of a simulated Supernova. If you haven’t read my last article, you might like to go through it to understand all of this super cool stuff in a simpler way!
我还向您解释了TARDIS如何以惊人的方式从模拟超新星发出的数十万个光包中包含的信息中构造出一个光谱。 如果您还没有阅读我的上一篇文章,您可能希望通过简单的方式阅读它,以了解所有这些超酷的东西!
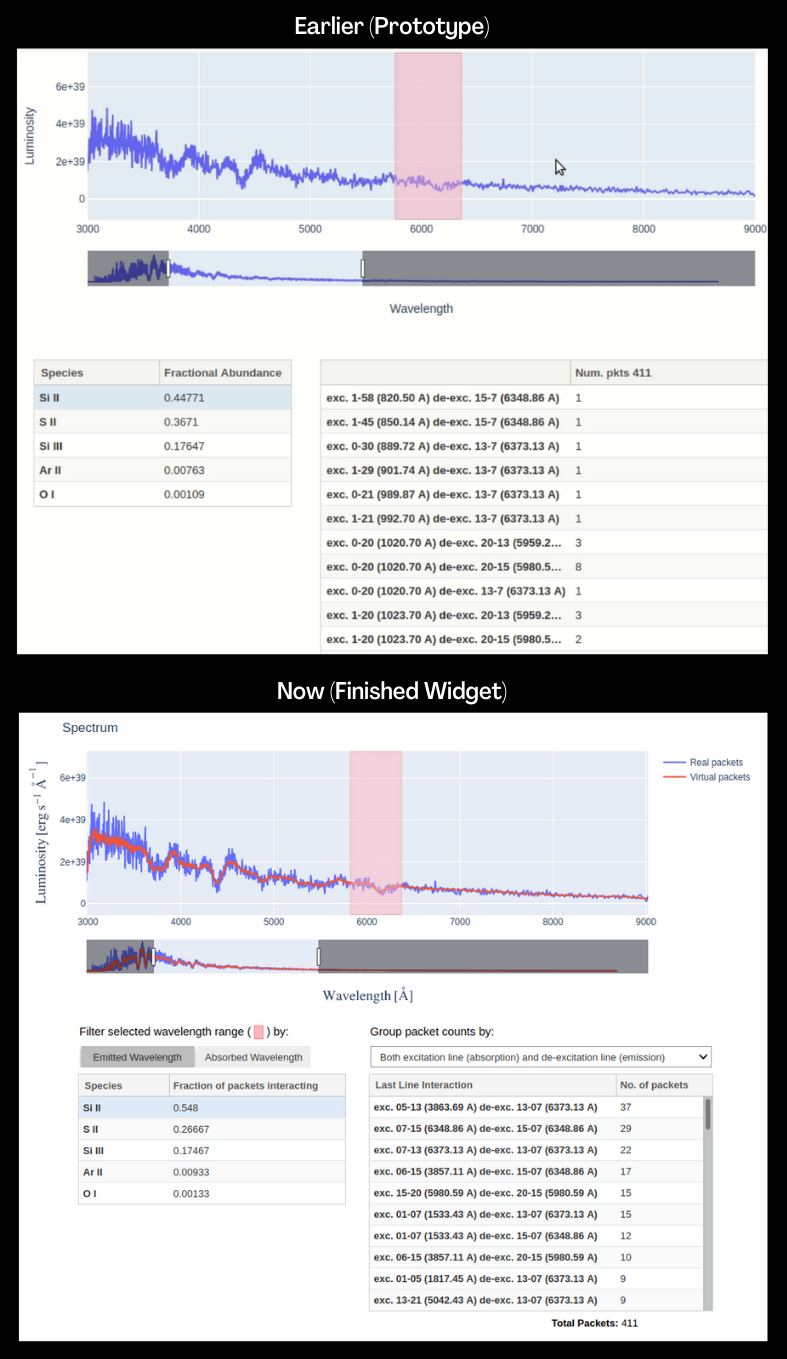
To further show how different interactions of light packets contribute to the luminosity in the model spectrum (wavelength vs luminosity plot), I started working on restructuring the legacy Kromer plot interface of TARDIS. But it needed a lot of improvements in its plot generation method. Thus keeping the GSoC deadline in mind, we have to put it on hold until I finish & release the Line Info Widget with a simple spectrum plot. In this article, I will not only show how the finished line info widget looks like but also how I understood the underlying Astrophysics better by data exploration!
为了进一步显示光包的不同相互作用如何影响模型光谱中的光度(波长与光度图),我开始着手重组TARDIS的传统Kromer图界面。 但是它需要在情节生成方法上进行很多改进。 因此,要牢记GSoC的截止日期,我们必须搁置它,直到完成并发布带有简单频谱图的Line Info Widget。 在本文中,我不仅将展示终点信息小部件的外观,还将展示如何通过数据探索更好地理解潜在的天体物理学!
精炼线信息小部件及其对我的理解! (Refining Line Info Widget and my Understanding of it!)
So last month, I converted Line Info Widget from a prototype to a fully-functional widget with a couple of additional features. Now it can be generated by a simple function call for any simulation model within Jupyter Notebooks, using the object-oriented interface I wrote for it.
因此,上个月,我将Line Info Widget从原型转换为具有几个附加功能的全功能Widget。 现在,可以使用我为此编写的面向对象的接口,通过对Jupyter Notebooks中的任何仿真模型进行简单的函数调用来生成该函数。
线路是什么:线路信息小部件的工作原理如何? (What’s the Line: How exactly Line Info Widget works?)
As I explained in the first article in this series,
正如我在本系列的第一篇文章中所解释的那样,
The elements present in a Supernova ejecta (or the guts of an exploded star!) imprint their characteristic features on the light spectrum obtained from it, due to light-matter interactions. While modelling a Supernova, TARDIS simulates each of these random interactions between light packets (photons) and atomic lines (possible transitions of electrons between excitation levels of an atom).
由于光与物质的相互作用 ,超新星喷射中的元素(或爆炸恒星的内胆!)将其特征刻在从其获得的光谱上。 在对超新星建模时,TARDIS会模拟光包(光子)和原子线(原子激发能级之间电子的可能跃迁)之间的这些随机相互作用。

This is what Line Info Widget is made for — it allows Astrophysicists to explore the atomic lines responsible for producing features in the simulated spectrum. By selecting a wavelength range on the spectrum plot, you can see the species that produced the features within that range. This is determined by counting the number of escaping packets that experienced their last interaction with each species. Packets can be filtered by the wavelength at which they were absorbed or emitted, using the toggle buttons.
这就是Line Info Widget的用途-允许天体物理学家探索负责在模拟光谱中产生特征的原子线。 通过在光谱图上选择一个波长范围,您可以看到在该范围内产生特征的物质。 这是通过计算逃逸数据包与每个物种之间最后一次交互的数量来确定的。 使用切换按钮,可以按照吸收或发射的波长过滤数据包。
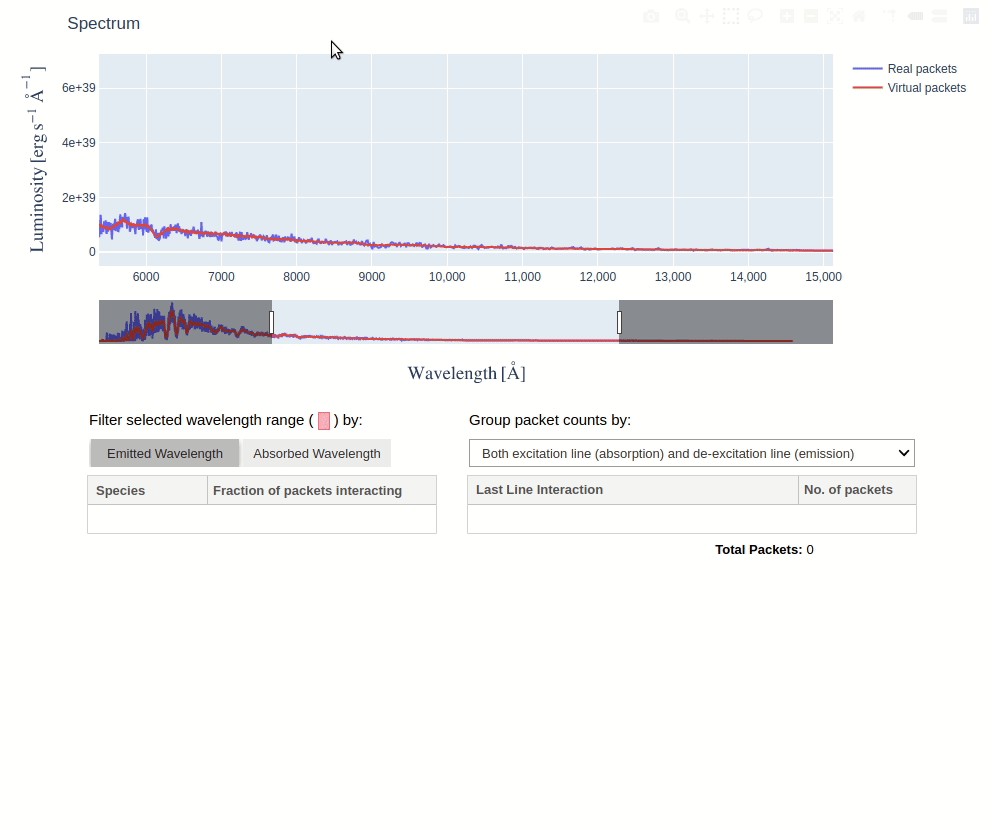
You can then click on a species to see the packets count for each last line interaction it experienced. Using the dropdown menu, these counts can be grouped by excitation lines, de-excitation lines, or both.
然后,您可以单击一个物种,以查看其经历的每个最后一行交互的数据包计数。 使用下拉菜单,可以将这些计数按激励线,去激励线或两者进行分组。
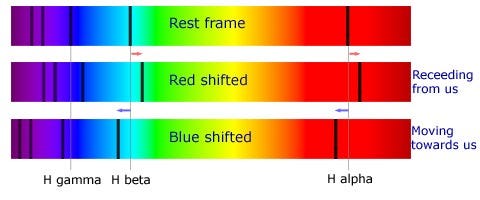
移动弹射器:光的多普勒频移 (Moving Ejecta: Doppler shift of Light)
The fun part about science is you learn things from exploration better than reading or hearing them from someone. While developing this widget, my mentors explained to me a couple of times that the spectrum we have is made from the observed wavelengths of the packets in a moving frame instead of that in the rest frame. This means that absorption/emission wavelengths of packets don’t necessarily match with that of an atomic line they interacted with, due to the Doppler shifts because the Supernova ejecta is continuously moving outward with thousands of km/s. For example, a packet with an observed wavelength of roughly 5000 Angstrom gets absorbed in the excitation of Si II from the 15th to 22nd level, which otherwise happens at 5057 Angstrom in rest wavelength.
科学的有趣之处在于,您从探索中学到的东西比从别人那里读或听的东西要好。 在开发此小部件时,我的导师向我解释了几次,我们所拥有的光谱是根据移动帧中而不是其余帧中数据包的观察波长得出的。 这意味着由于超新星喷射以数千公里/秒的速度连续向外移动,因此多普勒频移导致数据包的吸收/发射波长不一定与它们相互作用的原子线的吸收/发射波长匹配。 例如,观察到的大约5000埃波长的数据包在第15到22级的Si II激发中被吸收,否则将在静止波长的5057埃处发生。
When a spectrum is constructed by histogramming the observed wavelengths of packets (as I explained in my last article), this Doppler shift due to moving ejecta is evident as the shifted features. A feature in the spectrum for a particular interaction is no longer at the wavelength where it happens in the rest frame (i.e. the rest wavelength) but gets shifted by some wavelengths, i.e. it shows up at the observed wavelength which produced it in the moving frame.
当通过对观察到的数据包波长进行直方图构建光谱时(正如我在上一篇文章中所解释的),由于移动的射出而导致的多普勒频移显然是偏移的特征。 特定相互作用的光谱特征不再位于静止帧中发生的波长处(即静止波长),而是偏移了一些波长,即,它出现在运动帧中产生它的观察波长处。
Even after understanding this phenomenon, I was still unable to grasp how it connects with the Line Info Widget I was developing. So one day while writing documentation, I was playing around with the widget to see how different selections change data in tables. And I finally observed it when I found that not all absorption lines’ wavelengths fall in the selected wavelength range of packets.
即使了解了这种现象,我仍然无法掌握它与我正在开发的Line Info Widget之间的联系 。 因此,有一天在编写文档时,我在玩这个小部件,以了解不同的选择如何改变表中的数据。 当我发现并非所有吸收线的波长都在选定的数据包波长范围内时,我终于观察到它。
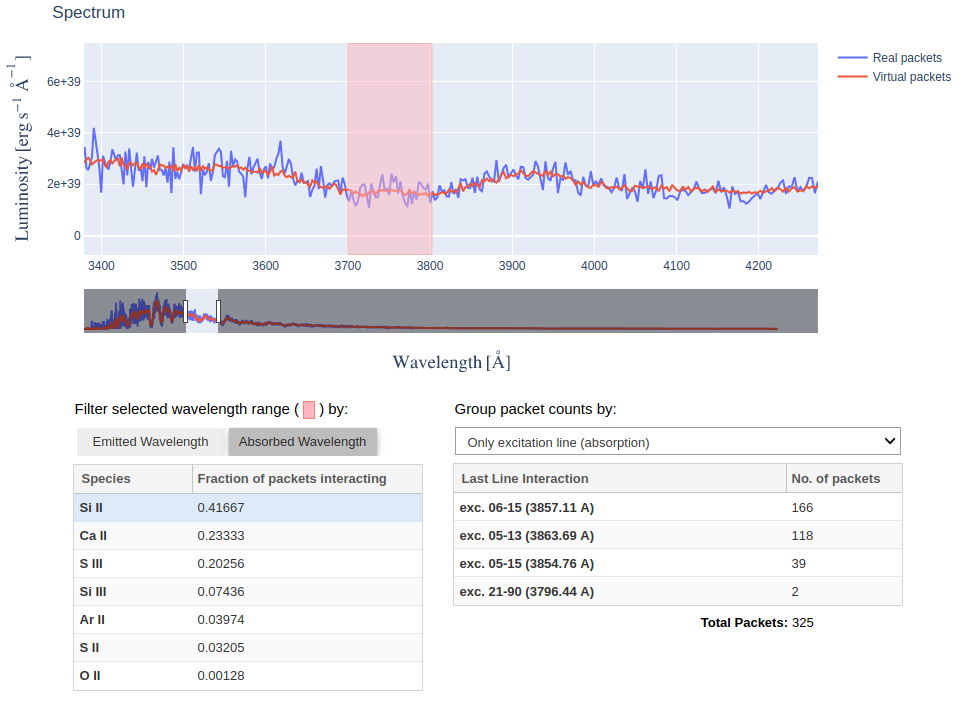
As you can see that by selecting the 3700–3800 Angstrom wavelength range and filtering packets present in it by their absorption wavelengths, the absorption wavelengths for Si II are still greater than 3800 (i.e. outside the selected range) which wouldn’t have happened if interaction happened in the rest frame. This clearly shows that due to the moving ejecta, the packets with their observed wavelengths within 3700–3800 interacted with Si II atomic lines having higher absorption wavelengths (in 3850–3860). Therefore, the imprinted feature (dip in selected wavelength range) is blue-shifted (moved toward lower wavelengths) in the observed spectrum because effectively an explosion moves matter in ejecta towards us!
如您所见,通过选择3700–3800埃的波长范围并通过其吸收波长过滤数据包中存在的数据包,Si II的吸收波长仍大于3800(即超出所选范围),如果交互发生在其余框架中。 这清楚地表明,由于移动的射流,其观测波长在3700-3800之间的数据包与吸收波长更高(在3850-3860中)的Si II原子线相互作用。 因此, 印迹特征(在选定的波长范围内 下降)在观察到的光谱中发生了 蓝移 (朝着较低的波长移动),因为有效地爆炸将喷出物中的物质移向我们!

This observation and followed inference was an Aha moment for me — I was like, “Oh yes! now I see what my mentors were talking about, in the context of Line Info Widget”. Like me, if you’re wondering if this blueshift is larger than the redshift of universal expansion that it neutralized it, then that’s not true! One of my mentors (Mark Magee) told me that when Astrophysicists talk about the blue-shifted features, it’s always relative to the rest wavelength i.e. they’ve already ignored the redshift of the host galaxy of Supernova.
这种观察和推论对我来说是一个Aha时刻-我就像,“哦,是的! 现在,在Line Info Widget的背景下,我看到了我的导师在谈论什么。” 像我一样,如果您想知道这个blueshift是否大于抵消它的通用扩展的redshift,那不是真的! 我的一位导师(马克·马吉)告诉我,当天体物理学家谈论蓝移特征时,它总是与其余波长有关,也就是说,他们已经忽略了超新星主星系的红移。
所有这些如何适应:理论光谱和观察光谱的匹配 (How all of this fits in: Matching Theoretical and Observed spectra)
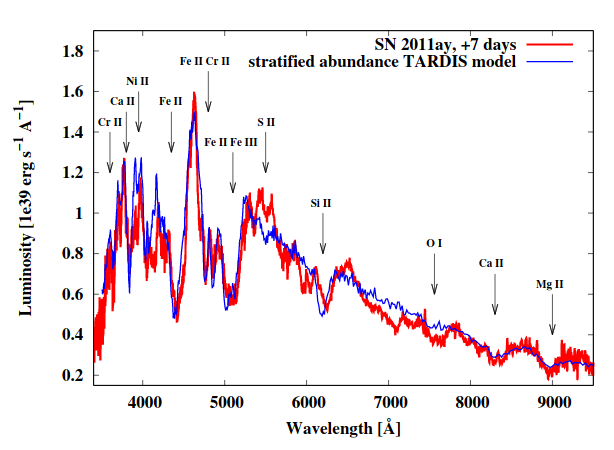
When studying a Supernova observed in the sky, Astrophysicists use computer simulations for drawing conclusions about its properties and ultimately the explosion mechanism & progenitor stars. First, they make some educated guesses about its properties like Supernova brightness and the abundances of the different chemical elements present in the ejecta. Then they use numerical code like TARDIS and pass these properties as input parameters to run the simulation for calculating the theoretical spectrum (which is being shown in Line Info Widget above).
当研究在天空中观察到的超新星时,天体物理学家使用计算机模拟得出有关其性质的结论,并最终得出爆炸机理和祖先恒星的结论。 首先,他们对其特性进行了一些有根据的猜测,例如超新星亮度和喷射器中不同化学元素的丰度。 然后,他们使用诸如TARDIS之类的数字代码,并将这些属性作为输入参数,以运行模拟以计算理论频谱(如上面的“行信息”小部件中所示)。
The main goal of doing so is to reproduce the observed spectrum of the target Supernova by tuning input parameters of the simulation. Hence by finding a close match between theoretical and observed spectra, Astrophysicists identify the parameters that actually describe the Supernova. The Line Info Widget I’ve developed will allow them to interactively discern the chemical species and line interactions responsible for different features in the spectrum, thereby making this matching process easier.
这样做的主要目的是通过调整模拟的输入参数来重现目标超新星的观测光谱。 因此,天文学家通过找到理论光谱和观察到的光谱之间的紧密匹配,来确定实际描述超新星的参数。 我开发的Line Info Widget将使他们能够交互式地辨别与光谱中不同特征有关的化学物质和线相互作用,从而使此匹配过程更加容易。
最后一点:整理我的工作 (Final touches: Wrapping up my work)
测试和文件 (Tests and Documentation)
The essential step to make code maintainable is to write tests for it. Considering the complexity of Line Info Widget, writing unit tests for it was a daunting task for me. But by using some great suggestions of TARDIS members and by trying multiple ways to use PyTest, I finally managed to test the functionality of Line Info Widget for several interactions, along with all the edge cases I can think of.
使代码可维护的重要步骤是为其编写测试。 考虑到Line Info Widget的复杂性,为此编写单元测试对我来说是一项艰巨的任务。 但是通过使用TARDIS成员的一些很好的建议,并尝试了多种使用PyTest的方法,我终于设法测试了Line Info Widget的功能,以便进行几种交互以及所有我能想到的边缘情况。
For showcasing the widgets I developed, I created a section titled TARDIS widgets in the docs. Writing documentation also played an important role in improving my understanding of the underlying physics of the widgets because not only I got to verbalize it but also because my mentors pointed out what I was getting wrong in the PR review. TARDIS widgets (yet to be published) consists of two pages — one describing how to use each widget and its additional functionalities, and the other is a notebook demonstrating how to generate each widget using the widgets subpackage I developed. By downloading this demo notebook, anyone (even you!) can quickly try out the new TARDIS widgets!
为了展示我开发的小部件,我在文档中创建了一个标题为TARDIS小部件的部分。 撰写文档在提高我对小部件的基本物理特性的理解方面也起着重要作用,这不仅是因为我要表达自己的观点,还因为我的导师指出了PR审查中出了错。 TARDIS小部件 (尚未发布)由两页组成-一页描述如何使用每个小部件及其附加功能,另一页是一个笔记本,演示如何使用我开发的小部件子包生成每个小部件 。 通过下载此演示笔记本,任何人(甚至您也可以!)都可以快速尝试新的TARDIS小部件!
GSoC'20最终报告 (Final Report of GSoC’20)
By the end of GSoC, student developers are required to submit a final report summarizing all the work they did during Summer so that it’s easy to access all the code from one place which can also act as a reference for the current state of their project. So I put together a brief summary of my work along with the links to all of my PRs as a web page. Since I was working with front-end web technologies, I wanted to try out publishing my report as a web page. I picked a nice template from HTML5UP and tweaked it as per my needs to finally create a nice-looking report that I’m kinda proud of! You should check it out to get a quick overview of all the work I did in the last three months:
到GSoC结束时,要求学生开发人员提交最终报告,以总结他们在夏季期间所做的所有工作,以便可以轻松地从一个地方访问所有代码,这些代码也可以作为项目当前状态的参考。 因此,我将自己的工作进行了简要总结,并以网页的形式链接到我所有PR的链接。 由于我正在使用前端Web技术,因此我想尝试将报告发布为网页。 我从HTML5UP中选择了一个不错的模板,并根据需要对其进行了调整,以最终创建一个令我感到骄傲的漂亮报告! 您应该查看一下,以快速了解我在过去三个月中所做的所有工作:
贷记额:将来怎么办? (Post-credits: What’s ahead?)
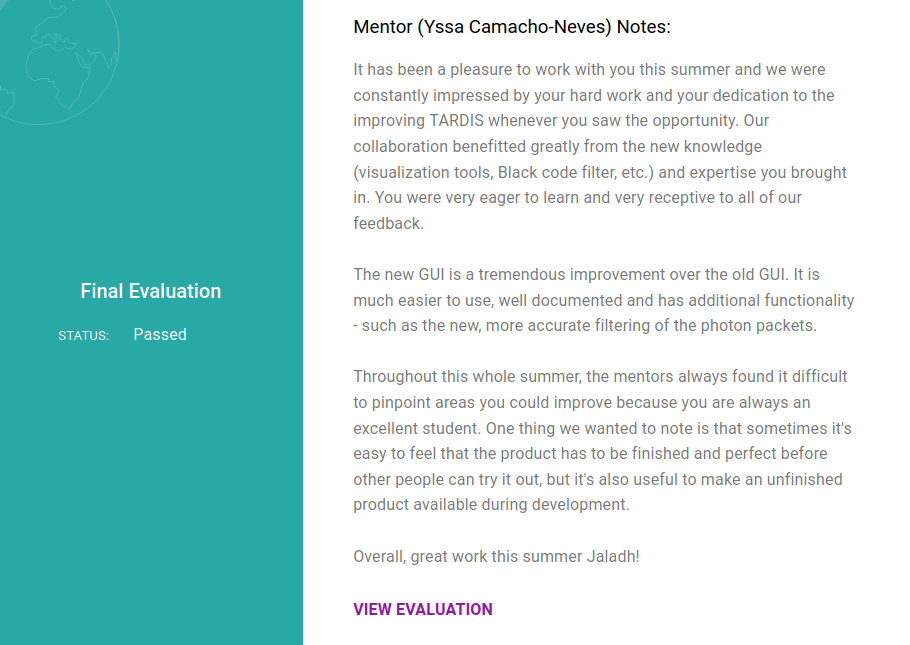
This has been an incredible Summer since I got to learn a lot about Astrophysics Research along with software development. Besides, I am fortunate to work with a group of such amazing and talented people, who are helping each other and TARDIS to grow! Yesterday, GSoC’20 results were declared and I passed the final evaluation with very encouraging feedback from my mentors!
自从我学习了很多有关天体物理学研究以及软件开发的知识以来,这真是一个不可思议的夏天。 此外,我很幸运能与一群如此出色而又才华横溢的人们一起工作,他们互相帮助,并使TARDIS成长! 昨天宣布了GSoC'20的结果,我通过了最终评估,并得到了我的导师的令人鼓舞的反馈!
Now, since the Line Info Widget is complete and ready to be merged, I’ve started working on fixing the Kromer Plot so that it can be integrated within the widget. Besides me and my mentors have several ideas to harness the power of GUI and interactive visualizations to make Supernova exploration easier. So there’s lots of interesting work to do, stay tuned by following us on Twitter!
现在,由于“行信息”窗口小部件已完成并且可以合并,因此我开始着手修复Kromer图,以便可以将其集成到窗口小部件中。 除了我和我的导师,还有几个想法可以利用GUI和交互式可视化的功能来简化Supernova的探索。 因此,有很多有趣的工作要做,请关注我们在Twitter上的关注 !
Thanks for reading all the way to the end. I would love to hear your comments/suggestions, please feel free to comment below or contact me on LinkedIn. Besides, if you find TARDIS cool, we always welcome new contributors to our open source project — get in touch with us.
感谢您一直阅读全文。 我想听听您的意见/建议,请随时在下面发表评论,或通过LinkedIn与我联系。 此外,如果您发现TARDIS很酷,我们总是欢迎新的贡献者加入我们的开源项目-与我们联系。
gsoc 任务


 被折叠的 条评论
为什么被折叠?
被折叠的 条评论
为什么被折叠?
 到【灌水乐园】发言


