


项目概况 (Project Overview)
Data scientists around the world are working for companies that use a sign-up business model to generate revenue. The idea is simple, the more users you have that pay for the service the more money you generate, you also generate money thanks to free users when the ads are displayed. However, in both cases you need users, and you need them to stay with you for a long time.
全世界的数据科学家都在为使用注册业务模型来产生收入的公司工作。 这个想法很简单,您为该服务付费的用户越多,您产生的钱就越多,同时,由于免费用户在展示广告时也能赚钱。 但是,在这两种情况下,您都需要用户,并且您需要他们与您在一起很长时间。
Sparkify is the name of the imaginary company that provided data for the students of Udacity Data Science Nanodegree to analyze the data and get familiar with building models that will provide the answer to which user will churn (leave service) and who will stay with the service. There are many questions that are needed to be answered in order to know who, why, when, and all the reasons behind it. In this article, we will uncover a small part of it.
Sparkify是虚构公司的名称,该公司为Udacity Data Science Nanodegree的学生提供数据,以分析数据并熟悉构建模型,从而为用户搅动(离开服务)以及谁将继续使用该服务提供答案。 为了知道谁,为什么,何时以及其背后的所有原因,需要回答许多问题。 在本文中,我们将揭示其中的一小部分。
数据探索 (Data Exploration)
The provided data set is as a fraction of the larger data set with a size of 12GB, for the purpose of this project only 128 MB will be used as the base of exploration.
提供的数据集只是大小为12GB的较大数据集的一部分,对于本项目而言,仅将128 MB用作探索的基础。
In data set we have 18 columns as below:
在数据集中,我们有18列,如下所示:
- Artist — which has 17656 unique artists in it 艺术家-其中有17656位独特的艺术家
- Auth — authentication level Auth-身份验证级别
- firstName — first name of the user firstName-用户的名字
- gender — gender of the user 性别-用户的性别
- itemInSession — log count in a session itemInSession-会话中的日志计数
- length — length of the song played (in seconds) length —播放的歌曲的长度(以秒为单位)
- location — user location 位置-用户位置
- method — GET or PUT HTTP request method 方法— GET或PUT HTTP请求方法
- page — page with which user is currently interacting 页面-用户当前正在与之交互的页面
- registration — timestamp of user’s registration 注册-用户注册的时间戳
- sessionId — session of the log sessionId-日志的会话
- song — song played by user 歌曲-用户播放的歌曲
- status — HTTP code of status — 200, 307, 404 status-状态的HTTP代码-200、307、404
- ts — timestamp of a given interaction ts —给定交互的时间戳
- userAgent — what user used as streaming service (Mac/Linux/Windows/iPhone/etc.) userAgent-用作流服务的用户(Mac / Linux / Windows / iPhone / etc。)
- userId — unique id of the user userId-用户的唯一ID
This particular dataset has 286500 rows of data of which 8346 has no userId, those needs to be removed as they won’t be useful for us at all.
这个特定的数据集有286500行数据,其中8346个没有userId,需要删除这些行,因为它们根本对我们没有用。
Based on quick data exploration we can find out that our user base consists of 225 unique users, of which 46.22% are females and 53.78% are males.
通过快速的数据探索,我们可以发现我们的用户群由225个唯一用户组成,其中女性占46.22%,男性占53.78%。
In order to further explore data, we need to define churn which in this case will be the users that have entered page called: ‘Cancellation Confirmation’, which confirms the resignation of the user from the service.
为了进一步探索数据,我们需要定义客户流失,在这种情况下,将是进入页面的用户:“取消确认”,该页面确认用户已退出服务。
Based on above we can explore further the data set, we can find out that our of 225 unique users that are in dataset 52 has churned, meaning left the service, and 173 are still valid users that utilize the service.
基于上面的内容,我们可以进一步探索数据集,我们可以发现数据集52中的225个唯一用户已经搅动,这意味着离开该服务,而173个仍然是使用该服务的有效用户。
Below graph portraits difference between females and males and how the distribution of churned and not churned users looks like:
下面的图表肖像说明了男性和女性之间的差异,以及搅动和不搅动用户的分布情况:
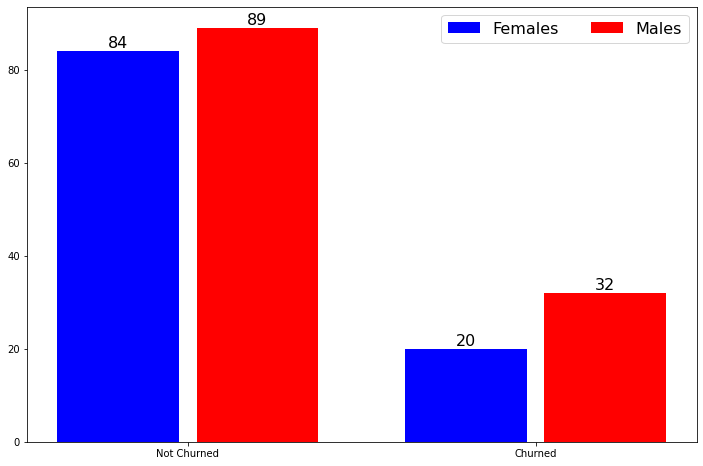
We can see that males are slightly more likely to churn the service than females, however, we need to remember that there are more male users in the dataset.
我们可以看到,男性比女性更容易流失该服务,但是,我们需要记住,数据集中有更多男性用户。
Next, we can check how the churn rate looks in paid or free users who used or still use the service, the graph below does just that:
接下来,我们可以检查使用或仍在使用该服务的付费或免费用户的客户流失率,下面的图形可以做到:
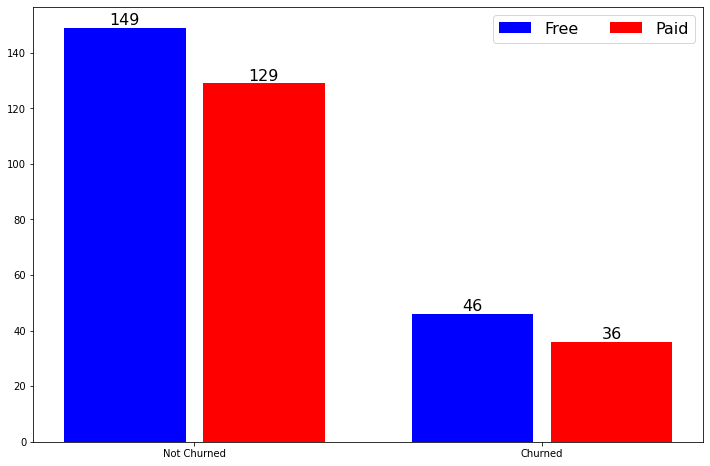
Based on above we can see that about 31% of free users have churned the service, while only 28% of the user that are using paid service has churned, this might be due to the fact that paid version of the service enables some additional features that make users stay with the service.
根据上面的内容,我们可以看到大约31%的免费用户使用了该服务,而只有28%的使用付费服务的用户使用了该服务,这可能是由于该服务的付费版本启用了一些附加功能使用户继续使用该服务。
Another part that we will look at is the pages of the service that users have visited and how that influenced their decision if they want to churn or not. Below the graph from the exploration of this part of the data:
我们将要看的另一部分是用户访问过的服务页面,以及这些页面如何影响他们是否愿意流失的决定。 在探索这部分数据的图表下方:
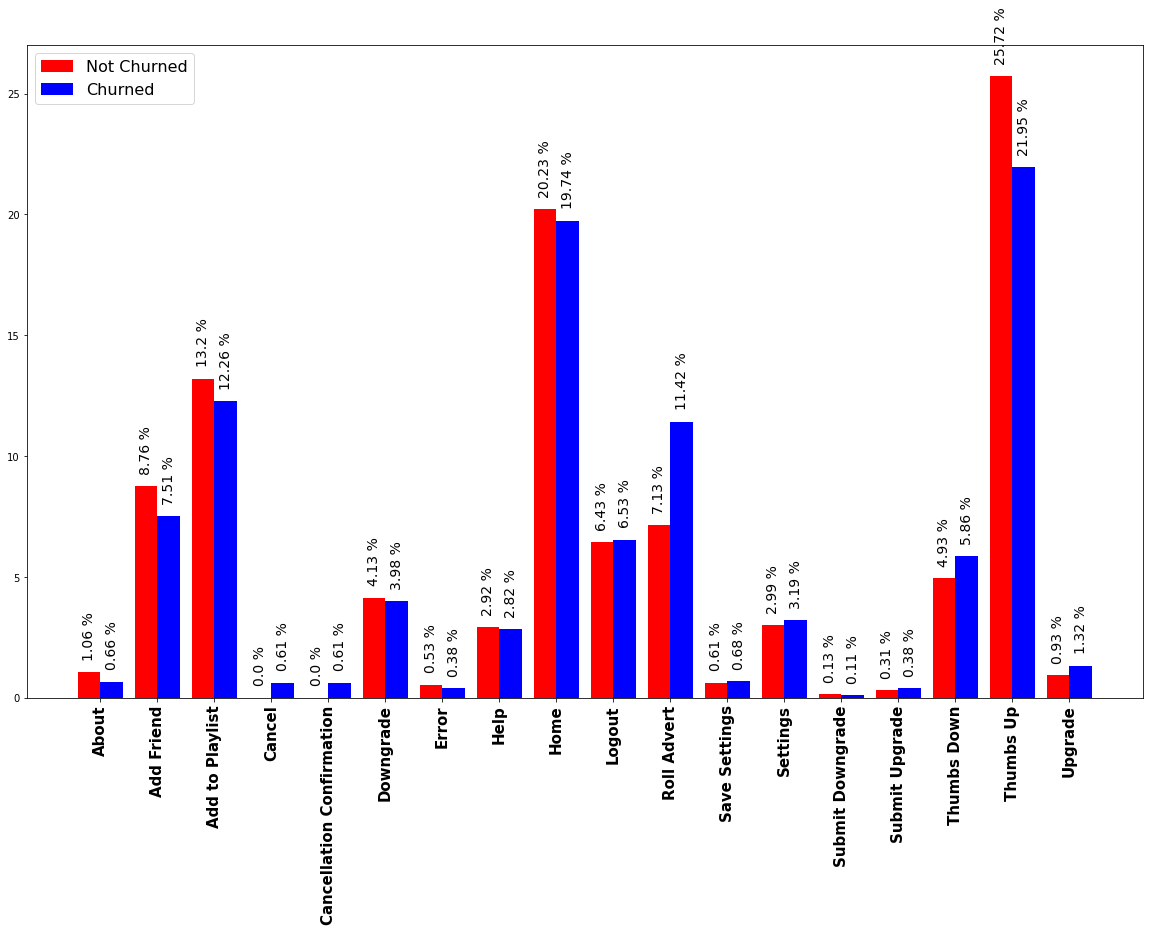
Based on the above plot we can easily see that there are some clear indicators of which pages might have annoyed our users that have churned, one of which would be “Roll Advert”, which would definitely make someone leave service it there is too many adds. We will definitely have to transform this data into numerical data in order to have them for our classification algorithms.
根据上面的图,我们可以很容易地看到,有一些明确的指标表明哪些页面可能会激怒我们的用户,其中之一就是“滚动广告”,这肯定会使某人离开服务,因为添加了太多内容。 我们绝对必须将这些数据转换为数值数据,以便将其用于我们的分类算法。
Those are a few examples of Data Exploration that provided some information on which features should be used in machine learning, that might impact the results.
这些是数据探索的一些示例,这些示例提供了一些有关在机器学习中应使用哪些功能的信息,这些功能可能会影响结果。
特征工程 (Feature Engineering)
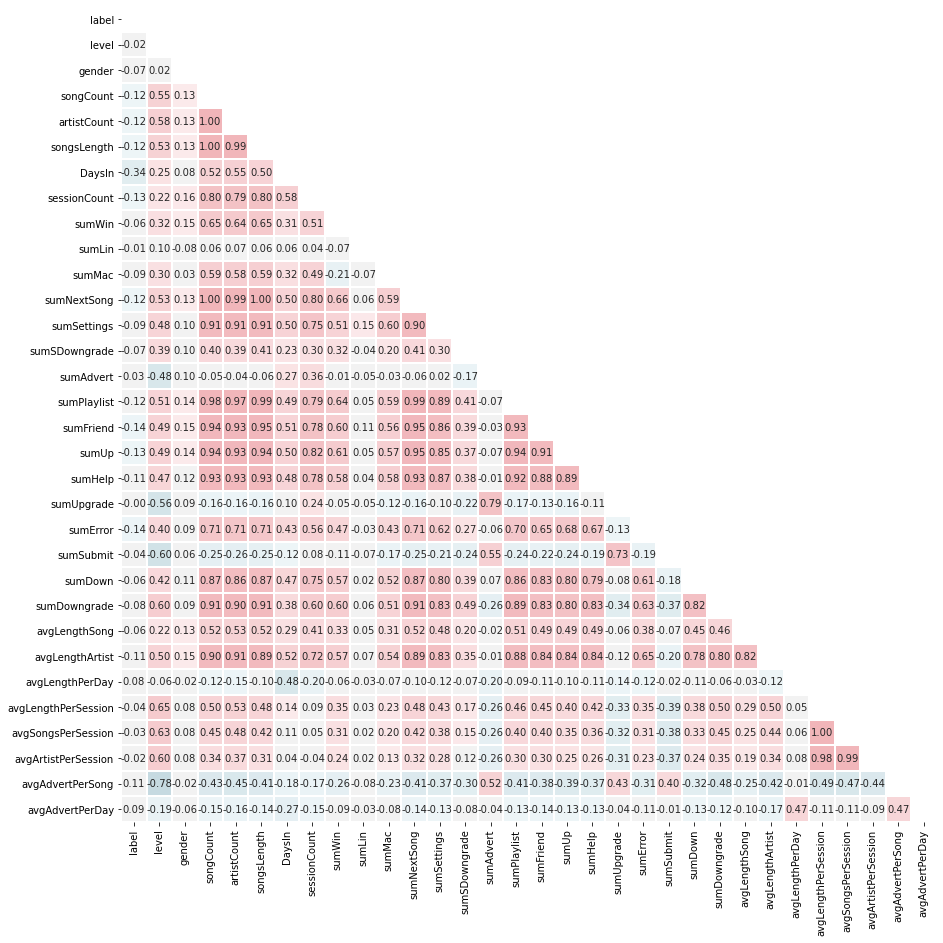
For this project, feature engineering took place twice, and the same can be said for the machine learning algorithm, the first version of the dataset that was used was the very basing transformation of data and had only 21 features as below (discard label):
对于这个项目,特征工程进行了两次,对于机器学习算法也可以说是相同的,所使用的数据集的第一个版本是非常基础的数据转换,并且只有以下21个特征(丢弃标签):
Afterward, 8 additional features have been added to the dataset, and machine learning was done once more on exactly the same parameters and algorithms as before, the second dataset had the following set of features:
之后,已向数据集中添加了8个其他功能,并且再次使用与以前完全相同的参数和算法进行了机器学习,第二个数据集具有以下一组功能:
机器学习 (Machine Learning)
To determine if the user will churn or not, we have used 4 different algorithms:
为了确定用户是否会流失,我们使用了4种不同的算法:
- Logistic regression classifier 逻辑回归分类器
- Random Forest Trees classifier 随机林木分类器
- Gradient Boosted classifier 梯度提升分类器
- Support Vector Machines classifier 支持向量机分类器
Each one of those had its specific parameters set. The details of it can be found in the Github repository over here.
其中的每一个都有其特定的参数集。 可以在此处的Github存储库中找到它的详细信息。
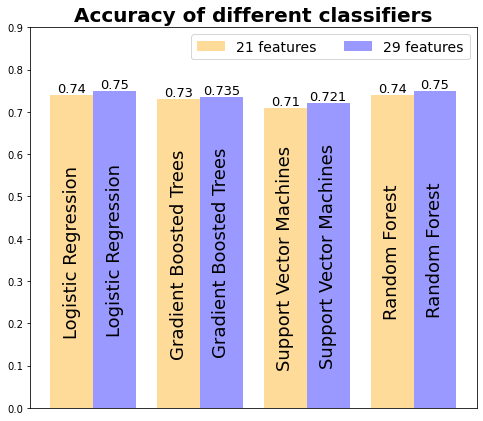
As was already mentioned in the previous point, we had 2 datasets that we have trained on, once the results were obtained all were compared. The results of this exercise are below.
如前所述,我们已经训练了2个数据集,一旦获得结果,就将所有数据集进行比较。 此练习的结果如下。
Accuracy comparison:
精度比较:
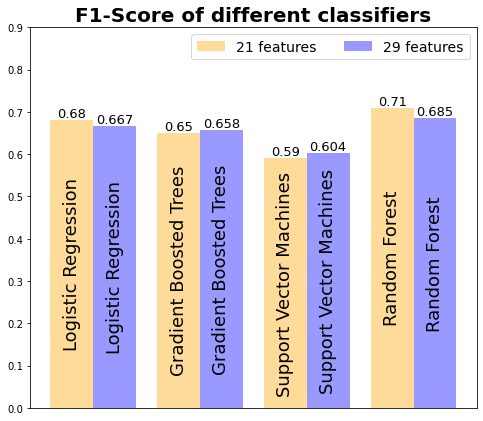
F1-score comparison:
F1得分比较:
结论 (Conclusion)
Based on the results from the machine learning we can easily see that more features equal better results, at least for the F1-score having higher values for 28 features datasets.
根据机器学习的结果,我们可以轻松地看到,更多的特征等于更好的结果,至少对于F1得分而言,它具有针对28个特征数据集的较高值。
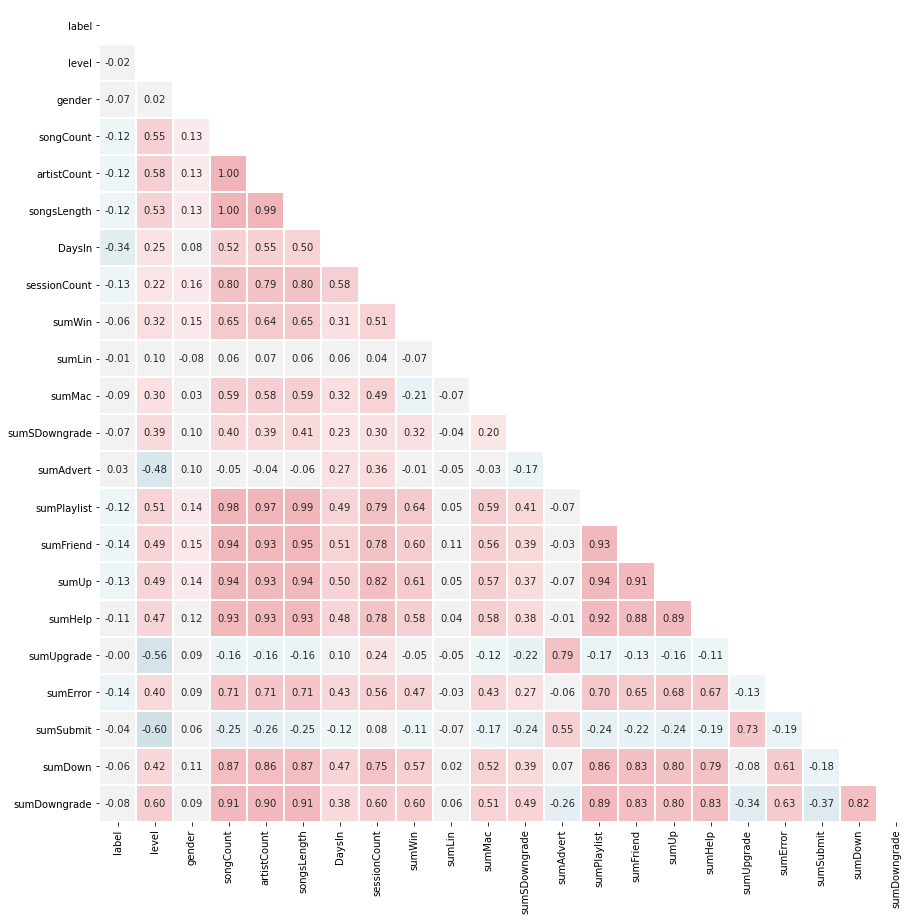
Overall as the learning from this project we can understand why data exploration and feature engineering are extremely important in machine learning. Having a good understanding of the data, understanding the correlation between different data (numerical or categorical) can greatly improve our models, can also allow us to describe problems with greater details as well as understand how different parts of the data set to impact our business.
总体而言,从该项目中学到的知识,我们可以理解为什么数据探索和特征工程在机器学习中非常重要。 对数据有很好的了解,了解不同数据(数值或分类)之间的相关性可以极大地改善我们的模型,还可以使我们更详细地描述问题,并了解数据集的不同部分如何影响我们的业务。
With this I would like to thank everyone who read this article, hopefully, it had some useful insights and information that will help you in the future.
在此,我要感谢阅读本文的每个人,希望它具有一些有用的见解和信息,这些信息将在将来对您有所帮助。
Happy coding!
编码愉快!


 296
296

 被折叠的 条评论
为什么被折叠?
被折叠的 条评论
为什么被折叠?
 到【灌水乐园】发言


