


支撑阻力指标
Note from Towards Data Science’s editors: While we allow independent authors to publish articles in accordance with our rules and guidelines, we do not endorse each author’s contribution. You should not rely on an author’s works without seeking professional advice. See our Reader Terms for details.
Towards Data Science编辑的注意事项: 尽管我们允许独立作者按照我们的 规则和指南 发表文章 ,但我们不认可每位作者的贡献。 您不应在未征求专业意见的情况下依赖作者的作品。 有关 详细信息, 请参见我们的 阅读器条款 。
Support and resistance are some of the most talked-about concepts when it comes to technical analysis. Support and resistance are used as price barriers, in which the price “bounces” off of. In this article, I will use the K-means clustering algorithm to find these different support and resistance channels, and trade with these insights.
在技术分析中,支撑和阻力是最受关注的概念。 支撑和阻力被用作价格壁垒,价格从中反弹。 在本文中,我将使用K-means聚类算法找到这些不同的支撑和阻力通道,并利用这些见解进行交易。
支撑和阻力: (Support and Resistance:)
To understand how best to implement something, we should first understand the thing that we want to implement.
要了解如何最好地实现某件事,我们应该首先了解我们想要实现的那件事。
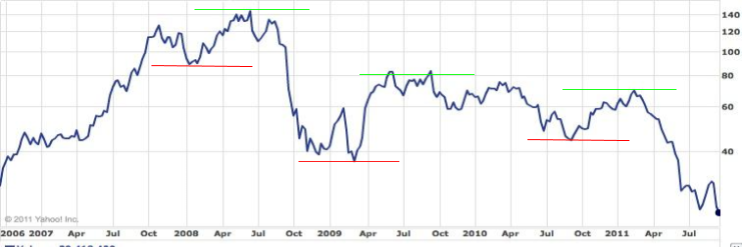
Support and Resistance, are two lines that are drawn on a graph, to form a channel, in which the price exists within.
支撑线和阻力线是在图形上绘制的两条线,形成价格存在于其中的通道。
Support and resistance are resultant of a security not being able to decrease or increase anymore, due to pressure from sellers or buyers. A good rule of thumb is that the more times a price is deflected against a support or resistance line, the less likely it will work again.
支持和阻力是由于卖方或买方的压力导致证券不再能够减少或增加的结果。 一条好的经验法则是,价格相对于支撑线或阻力线偏转的次数越多,其再次发挥作用的可能性就越小。
Support and resistance give good insight into entry points and selling points, as the support and resistance lines are theoretically the lowest and highest points for that limited time period.
支撑位和阻力位可以很好地了解切入点和卖出点,因为理论上,支撑位和阻力位是该有限时间段内的最低和最高点。
Downsides of the support and resistance strategy is that it works for an unknown period of time, and the lines are subjective and are therefore subject to human error.
支持和抵抗策略的缺点是,它在未知的时间段内都可以正常工作,并且线路是主观的,因此容易遭受人为错误的影响。
程序概念: (Program Concept:)
The K-means clustering algorithm, finds different sections of the time series data, and groups them into a defined number of groups. This number (K) can be optimized. The highest and lowest value of each group is then defined as the support and resistance values for the cluster.
K-均值聚类算法,查找时间序列数据的不同部分,并将其分组为定义的组数。 此数字(K)可以优化。 然后将每个组的最高和最低值定义为群集的支撑和阻力值。
Now that we know how the program is intended, let’s try to recreate it in Python!
现在我们知道了程序的意图,让我们尝试在Python中重新创建它!
代码: (The Code:)
import yfinance
df = yfinance.download('AAPL','2013-1-1','2020-1-1')
X = np.array(df['Close'])
This script is to access data for the Apple stock price. For this example, we are implementing the support and resistance only on the closing price.
该脚本用于访问Apple股票价格的数据。 对于此示例,我们仅对收盘价实施支撑和阻力。
from sklearn.cluster import KMeans
import numpy as np
from kneed import DataGenerator, KneeLocator
sum_of_squared_distances = []
K = range(1,15)
for k in K:
    km = KMeans(n_clusters=k)
    km = km.fit(X.reshape(-1,1))
    sum_of_squared_distances.append(km.inertia_)
kn = KneeLocator(K, sum_of_squared_distances,S=1.0, curve="convex", direction="decreasing")
kn.plot_knee()
# plt.plot(sum_of_squared_distances)
This script is to test the different values of K to find the best value:
该脚本用于测试K的不同值以找到最佳值:
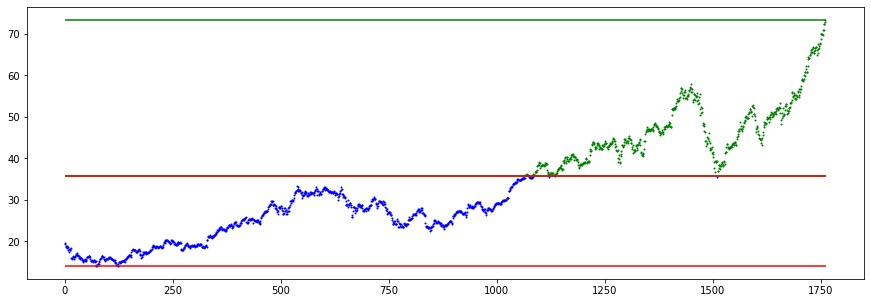
The K-value of 2 creates support and resistance lines that will never be reached for a long time.
K值2会创建支撑线和阻力线,这些支撑线和阻力线将永远不会达到。
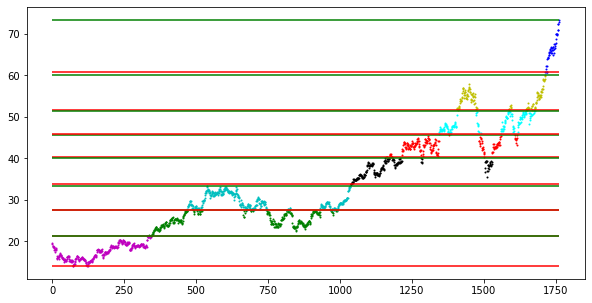
A K-value of 9 creates support and resistance that are far too common and make it difficult to make predictions.
K值为9时会产生太常见的支撑和阻力,因此很难进行预测。
Therefore, we have to find the best value of K, calculated by the elbow point when comparing variance between K values. The elbow point is the biggest improvement, given a certain movement.
因此,当比较K值之间的方差时,我们必须找到由弯头计算出的K的最佳值。 给定一定的移动量,肘点是最大的改善。
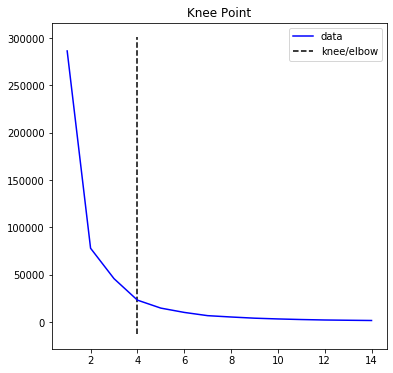
Based on the kneed library, the elbow point is at 4. This means that the optimum K value is 4.
根据膝盖库,肘点为4。这意味着最佳K值为4。
kmeans = KMeans(n_clusters= kn.knee).fit(X.reshape(-1,1))
c = kmeans.predict(X.reshape(-1,1))
minmax = []
for i in range(kn.knee):
    minmax.append([-np.inf,np.inf])
for i in range(len(X)):
    cluster = c[i]
    if X[i] > minmax[cluster][0]:
        minmax[cluster][0] = X[i]
    if X[i] < minmax[cluster][1]:
        minmax[cluster][1] = X[i]
This script finds the minimum and maximum value for the points that reside in each cluster. These, when plotted, become the support and resistance lines.
该脚本查找每个群集中的点的最小值和最大值。 当绘制这些线时,它们将成为支撑线和阻力线。
from matplotlib import pyplot as plt
for i in range(len(X)):
    colors = ['b','g','r','c','m','y','k','w']
    c = kmeans.predict(X[i].reshape(-1,1))[0]
    color = colors[c]
    plt.scatter(i,X[i],c = color,s = 1)for i in range(len(minmax)):
    plt.hlines(minmax[i][0],xmin = 0,xmax = len(X),colors = 'g')
    plt.hlines(minmax[i][1],xmin = 0,xmax = len(X),colors = 'r')
This script plots the support and resistance, along with the actual graph of the prices, which are color coded based on the cluster. Unfortunately, I think that the colors are limited, meaning that there is a limited K value in which the data can be color coded.
该脚本绘制了支撑和阻力以及价格的实际图形,这些图形根据集群进行了颜色编码。 不幸的是,我认为颜色是有限的,这意味着可以对数据进行颜色编码的K值有限。
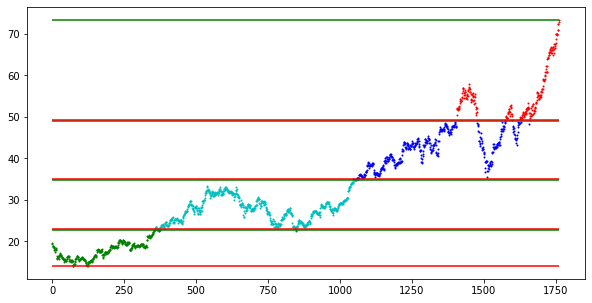
This is the result of the program, a set of support and resistance lines. Keep in mind that the lines are most accurate, when the values fall back into the channel. Additionally, the final resistance line would be the least accurate ,as it takes the last value into account, without considering any other values.
这是程序的结果,是一组支撑线和阻力线。 请记住,当值回落到通道中时,线条最准确。 另外,最终的阻力线将是最不准确的,因为它将最后一个值考虑在内,而不考虑任何其他值。
感谢您阅读我的文章! (Thank you for reading my article!)
翻译自: https://towardsdatascience.com/using-k-means-clustering-to-create-support-and-resistance-b13fdeeba12
支撑阻力指标


 102
102

 被折叠的 条评论
为什么被折叠?
被折叠的 条评论
为什么被折叠?
 到【灌水乐园】发言


