


实现方法有两种:1.echarts 2.canvas绘制折线。
此处介绍echarts绘制方法:
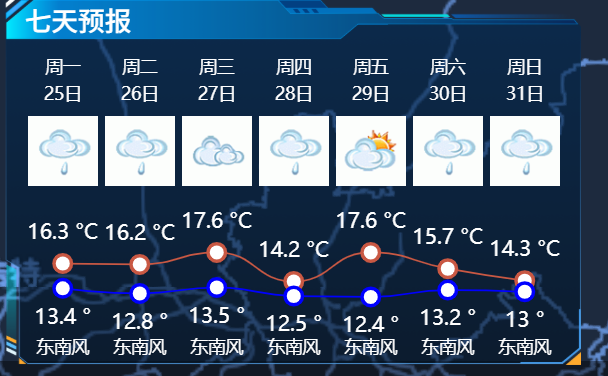
 import rain from '@/assets/imgs/meteorologicalServices/rain.png'
 const option =  {


        grid: {


          show: true,
          backgroundColor: 'transparent',
          opacity: 0.3,
          borderWidth: '0',
          top: '120',
          bottom: '0%'
        },
        tooltip: {


          trigger: 'axis'
        },
        legend: {


          show: false
        },
        xAxis: [
          // 日期
          {


            type: 'category',
            boundaryGap: false,
            position: 'top',
            offset: 90,
            zlevel: 100,
            axisLine: {


              show: false
            },
            axisTick: {


              show: false
            },
            axisLabel: {


              interval: 0,
              formatter: [
                '{a|{value}}'
              ].join('\n'),
              rich: {


                a: {


                  color: 'white',
                  fontSize: 10
                }
              }
            },
            nameTextStyle: {


            },
            data:  ["周一","周二","周三","周四","周五","周六","周日"]
          },
          // 星期
          {


            type: 'category',
            boundaryGap: false,
            position: 'top',
            offset: 75,
            zlevel: 100,
            axisLine: {


              show: false
            },
            axisTick: {


              show: false
            },
最低0.47元/天 解锁文章


 1523
1523

 被折叠的 条评论
为什么被折叠?
被折叠的 条评论
为什么被折叠?
 到【灌水乐园】发言


