 Metron仪表板增强


 本文介绍了如何使用Kibana配置Metron仪表板以可视化Squid事件数据,包括创建索引模板、配置仪表板面板等步骤。
备注:
设置Metron的页面;
Now that we have Metron configured to parse, index and persist telemetry events and Nifi pushing data to Metron, lets now visualize this streaming telemetry data in the Metron UI. We will be adding 3 new panels to visualize the Squid Events: Histogram Panel, Count Panel and Detail Panel
Step 1: Setup and Prerequisites
- Complete the instructions in Adding a new Telemetry Data Source
- Make sure the following variables are configured based on your environment:
- KAFKA_HOST = The host where a Kafka broker is installed.
- ZOOKEEPER_HOST = The host where a Zookeeper server is installed.
- PROBE_HOST = The host where your sensor, probes are installed. If don't have any sensors installed, pick the host where a Storm supervisor is running.
- SQUID_HOST = The host where you want to install SQUID. If you don't care, just install SQUID on the PROBE_HOST.
- NIFI_HOST = Host where you will install NIFI. You want this this to be same host on which you installed Squid.
- HOST_WITH_ENRICHMENT_TAG = The host in your inventory hosts file that you put under the group "enrichment."
- SEARCH_HOST = The host where you have Elastic or Solr running. This is the host in your inventory hosts file that you put under the group "search". Pick one of the search hosts.
- SEARCH_HOST_PORT = The port of the search host where indexing is configured. (e.g., 9300)
- METRON_UI_HOST = The host where your Metron UI web application is running. This is the host in your inventory hosts file that you put under the group "web."
- METRON_VERSION = The release of the Metron binaries you are working with. (e.g., 0.2.0BETA-RC2)
Step 2: Create More Squid Sensor Data
The previous tutorials covering Squid produced a limited data set. These consisted of a few basic requests. To make this tutorial more interesting, we are going to need a bit more variety in the sample data.
- ssh into SQUID_HOST as root
- Copy and paste the following set of links to a local file called `links.txt`.
 https://www.amazon.com/Cards-Against-Humanity-LLC-CAHUS/dp/B004S8F7QM/ref=zg_bs_toys-and-games_home_1?pf_rd_p=2140216822&pf_rd_s=center-1&pf_rd_t=2101&pf_rd_i=home&pf_rd_m=ATVPDKIKX0DER&pf_rd_r=2231TS0FE044EZT85PQ4
    https://www.amazon.com/Brain-Game-Cube-Intelligence-Development/dp/B01CRXM1JU/ref=zg_bs_toys-and-games_home_2?pf_rd_p=2140216822&pf_rd_s=center-1&pf_rd_t=2101&pf_rd_i=home&pf_rd_m=ATVPDKIKX0DER&pf_rd_r=MANXEWDTKDH2RD9Y3466
    https://www.amazon.com/Zuru-Balloons-different-colors-Seconds/dp/B00ZPW3U14/ref=zg_bs_toys-and-games_home_3?pf_rd_p=2140216822&pf_rd_s=center-1&pf_rd_t=2101&pf_rd_i=home&pf_rd_m=ATVPDKIKX0DER&pf_rd_r=MANXEWDTKDH2RD9Y3466
    https://www.amazon.com/MAGINOVO-Bluetooth-Headphones-Wireless-Earphones/dp/B01EFKFQL8/ref=zg_bs_electronics_home_1?pf_rd_p=2140225402&pf_rd_s=center-2&pf_rd_t=2101&pf_rd_i=home&pf_rd_m=ATVPDKIKX0DER&pf_rd_r=MANXEWDTKDH2RD9Y3466
    https://www.amazon.com/Amazon-Fire-TV-Stick-Streaming-Media-Player/dp/B00GDQ0RMG/ref=zg_bs_electronics_home_2?pf_rd_p=2140225402&pf_rd_s=center-2&pf_rd_t=2101&pf_rd_i=home&pf_rd_m=ATVPDKIKX0DER&pf_rd_r=MANXEWDTKDH2RD9Y3466
    http://www.walmart.com/ip/All-the-Light-We-Cannot-See/26737727
    http://www.walmart.com/ip/Being-Mortal-Medicine-and-What-Matters-in-the-End/36958209
    http://www.walmart.com/ip/My-Brilliant-Friend-Book-One-Childhood-Adolescence/20527482
    http://www.walmart.com/ip/A-Game-of-Thrones/402949
    http://www.bbc.co.uk/capital/story/20160622-there-are-people-making-millions-from-your-pets-poo
    http://www.bbc.co.uk/earth/story/20160620-can-we-predict-the-time-of-our-death
    http://www.bbc.co.uk/news/uk-england-somerset-36596557
- Run this command to choose one of the links above at random and make a request for that link through Squid. Leave this command running in a terminal so that a continual feed of data is generated as we work through the remainder of this tutorial.
while sleep 2; do cat links.txt | shuf -n 1 | xargs -i squidclient -g 4 -v {}; done - The previous command is generating log records at `/var/log/squid/access.log`. As long as Nifi is still running that we created in Adding a new Telemetry Data Source these event should be pushed to Metron's Telemetry Ingest layer
- . Ensure that the parser topology for Squid continues to run based on the steps outlined in the previous tutorials.
Step 3: Create an Index Template
To work with the Squid data in Kibana, we need to ensure that the data is landing in the search index with the correct data types. This can be achieved by defining an index template.
- Run the following command to create an index template for Squid.
 curl -XPOST $SEARCH_HOST:$SEARCH_PORT/_template/squid_index -d '
 {
 "template": "squid_index*",
 "mappings": {
 "bro_doc": {
 "_timestamp": {
 "enabled": true
 },
 "properties": {
 "timestamp": {
 "type": "date",
 "format": "epoch_millis"
 },
 "source:type": {
 "type": "string",
 "index": "not_analyzed"
 },
 "action": {
 "type": "string",
 "index": "not_analyzed"
 },
 "bytes": {
 "type": "integer"
 },
 "code": {
 "type": "string",
 "index": "not_analyzed"
 },
 "domain_without_subdomains": {
 "type": "string",
 "index": "not_analyzed"
 },
 "full_hostname": {
 "type": "string",
 "index": "not_analyzed"
 },
 "elapsed": {
 "type": "integer"
 },
 "method": {
 "type": "string",
 "index": "not_analyzed"
 },
 "ip_dst_addr": {
 "type": "string",
 "index": "not_analyzed"
 }
 }
 }
 }
 }'
- By default, Elasticsearch will attempt to analyze all fields of type string. This means that Elasticsearch will tokenize the string and perform additional processing to enable free-form text search. In many cases, and all cases for the Squid data, we want to treat each of the string fields as enumerations. This is why most fields in the index template are `not_analyzed`.
- An index template will only apply for indices that are created after the template is created. Delete the existing Squid indices so that new ones can be generated with the index template.
curl -XDELETE $SEARCH_HOST:9200/squid*
- Wait for the Squid index to be re-created. This may take a minute or two based on how fast the Squid data is being consumed in your environment.
curl -XGET node1:9200/squid*
Step 4: Configure the Squid Index in Kibana
Now that we have a Squid index with all of the right data types, we need to tell Kibana about this index.

Click on the image above to see each of these steps performed.
1. Login to your Kibana user interface http://METRON_UI_HOST:5000 and then click on 'Settings', then 'Indices'.
2. A text field will prompt for the name of the index. Type `squid*` within the text field. Every hour or day, depending on the specific configuration, a new Squid index will be created. Using this pattern will match against all Squid indices for all time periods.
3. Click outside of that text box and wait for the 'Time-field name' input field to populate. Since there is only one timestamp in the index, this should default to a field called `timestamp`. If this does not happen simply choose the field `timestamp`.
4. Then click the 'Create' button.
Step 5: Review the Squid Data
Now that Kibana is aware of the new Squid index, let's take a look at the data.

Click on the image above to see each of these steps performed.
1. Click on `Discover` and then choose the newly created `squid*` index pattern.
2. By clicking any of the fields on the left menu, you can see a representation of the variety of data for that specific fields.
3. Clicking on a specific record will show each field available in the data.
Step 6: Adding Squid Event Count Panel to Dashboard
- Log into the Metron UI Dashboard: http://METRON_UI_HOST:5000
- Select "Visualize" Tab --> Select "Metric" Visualization"= --> Select "From a new search" for Search Source --> Select "squid*" index source –> Click the Save disk icon on the top right
- Name the Visualization "Squid Event Count" and click Save
- Select "Dashboard" Tab --> Click the plus icon --> Select "Visualization" tab --> Search for "Squid Event Count" --> Select it
- The visualization will be added to the bottom of the dashboard
- Click the save icon on the top right to save the dashboard.
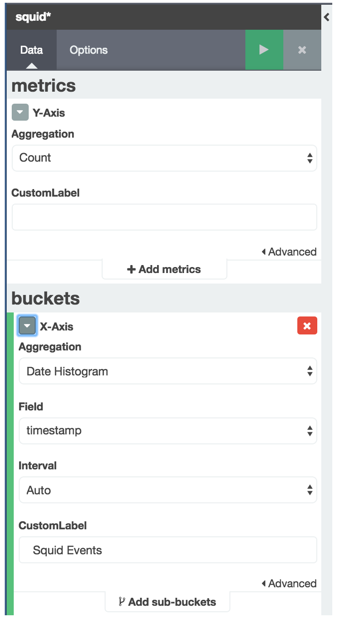
Step 7: Creating a Histogram Panel
- Log into the Metron UI Dashboard: http://METRON_UI_HOST:5000
- Select "Visualize" Tab --> Select "Line Chart" Visualization --> Select "From a new search" for Search Source --> Select "squid*" index source
- Configure the Visualization like the following:
- Click the Save Icon on the right right corner --> Name the Visualization "Squid Events Histogram" and click Save
- Select "Dashboard" Tab --> Click the plus icon --> Select "Visualization" tab --> Search for "Squid Events Histogram" --> Select it
- The visualization will be added to the bottom of the dashboard
- Click the save icon on the top right to save the dashboard.
Step 8: Adding a Detail Panel
- Log into the Metron UI Dashboard: http://METRON_UI_HOST:5000
- Select "Discover" Tab --> Select the "squid*" index
- Search for only docs in this index with type of squid_doc
- Type the following in search "_type: squid_doc"
- click the search icon
- Now we only to select subset of the fields that we want to display in the detail panel. In the left hand panel under "Available Fields", "add" the following fields:
- full_hostname
- ip_src_addr
- ip_dst_addr
- original_string
- method
- type
- The discover/search panel should look something like the following:
- Click the "Save" icon on the top right corner --> name the search "Squid Event Details" --> Click Save
- Select "Dashboard" Tab --> Click the plus icon --> Select "Searches" tab --> Search for "Squid Event Details" --> Select it
- The visualization will be added to the bottom of the dashboard
- Click the save icon on the top right to save the dashboard.

Step 9: The Dashboard with the 3 Squid Panels
The following is what the new dashboard would look like with the 3 squid panels added.

Summary
At this point you should be comfortable customizing a dashboard as you add new sources of telemetry to Metron. This article introduced Metron's default dashboard that is built upon Kibana 4. It covered the elements present in the dashboard and how you can extend the dashboard for your own purposes.
原文来自:https://cwiki.apache.org/confluence/display/METRON/Enhancing+Metron+Dashboard


 5754
5754

 被折叠的 条评论
为什么被折叠?
被折叠的 条评论
为什么被折叠?
 到【灌水乐园】发言


