


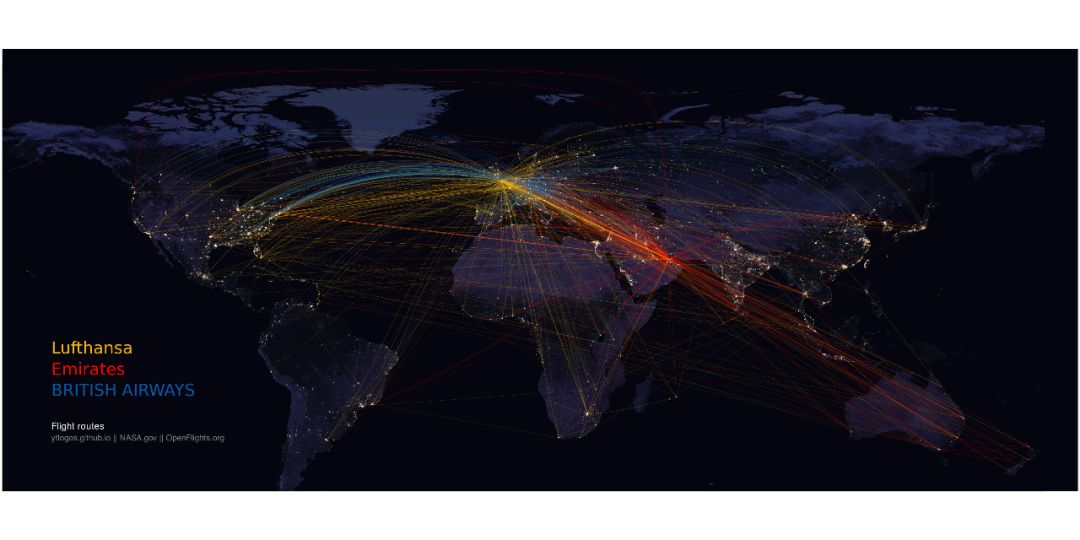
 这篇博客介绍了如何利用R语言和多个数据源,包括NASA的夜间地图及OpenFlights.org的数据,来绘制世界航班路线图。作者详细阐述了从数据下载、数据整理到最终的可视化过程,展示了Lufthansa、Emirates、British Airways、Air China和China Southern Airlines等航空公司的航线分布。
作者简介Introduction
taoyan:伪码农,R语言爱好者,爱开源。 个人博客: https://ytlogos.github.io/ 、

 **
**
一、 简介**
本文基于NASA的夜间地图(https://www.nasa.gov/specials/blackmarble/2016/globalmaps/BlackMarble\_2016\_01deg.jpg)的基础上进行世界航班路线可视化,参考多篇博客以及可视化案例。 1. 包加载 本博客使用的包较多,利用pacman包里的p_load()函数进行加载。
library(pacman) p_load(tidyverse, data.table, geosphere, grid, jpeg, plyr)
2. 数据准备 使用的数据来自于OpenFlights.org(https://openflights.org/data.html)。 3.数据下载
download.file(“https://raw.githubusercontent.com/jpatokal/openflights/master/data/airlines.dat",destfile = “airlines.dat”, mode = “wb”) download.file(“https://raw.githubusercontent.com/jpatokal/openflights/master/data/airports.dat",destfile = “airports.dat”, mode = “wb”) download.file(“https://raw.githubusercontent.com/jpatokal/openflights/master/data/routes.dat",destfile = “routes.dat”, mode = “wb”)
4.数据导入
airlines
5. 数据整理
# 添加列名colnames(airlines) # 类型转换 routes$airline_id # airlines与routes数据融合 flights # flights与airports数据融合 airports_orig # 剔除缺失值 flights # 最后数据如下 head(flights[,c(1:5)])
6. 下面就是准备地理信息数据 本文主要是可视化地理信息上的点与点之间的连接,这可以通过geosphere包里的函数gcIntermediate()很轻松实现。具体使用方法可以参考这里(http://flowingdata.com/2011/05/11/how-to-map-connections-with-great-circles/)。
# 按航空公司拆分数据集 flights_split # Calculate intermediate points between each two locations flights_all # 转换
 最低0.47元/天 解锁文章


 被折叠的 条评论
为什么被折叠?
被折叠的 条评论
为什么被折叠?
 到【灌水乐园】发言


