


 文章讲述了在使用Python进行决策树可视化时,如何通过代码1中引入黑块的问题,以及通过IO流和字符串操作(如替换`
`)来解决代码1中的黑块问题,以得到无黑块的输出图像。
文章讲述了在使用Python进行决策树可视化时,如何通过代码1中引入黑块的问题,以及通过IO流和字符串操作(如替换`
`)来解决代码1中的黑块问题,以得到无黑块的输出图像。
老规矩,先上代码:
代码1,这是有黑块的,dot_data存到本地:
import pydotplus
import os
from sklearn.datasets import load_iris
from sklearn.tree import DecisionTreeClassifier
from sklearn.tree import export_graphviz
from PIL import Image


Iris = load_iris()
X = Iris.data[:, 2:]  # petal length and width
y = Iris.target

tree_clf = DecisionTreeClassifier(max_depth=2, criterion='entropy')
tree_clf.fit(X, y)

os.makedirs("output/决策树/", exist_ok=True)  # 创建目录,如果不存在则创建
export_graphviz(
    tree_clf,
    out_file="output/决策树/Iris_tree.dot",
    feature_names=Iris.feature_names[2:],
    class_names=Iris.target_names,
    rounded=True,
    filled=True
)
graph = pydotplus.graph_from_dot_file("output/决策树/Iris_tree.dot")
dot_data = graph.to_string()
# dot_data = dot_data.replace('\n', '<br/>')
print(dot_data)
graph = pydotplus.graph_from_dot_data(dot_data)
graph.write_png("output/决策树/Iris_tree.png")
# image = Image.open("output/决策树/Iris_tree.png")
# image.show()
代码2,这是没有黑块的,用的IO流:
from sklearn import datasets
from sklearn import tree
from sklearn.metrics import classification_report
from sklearn.model_selection import train_test_split
from sklearn.tree import export_graphviz
from sklearn.tree import DecisionTreeClassifier
from sklearn.datasets import load_iris
from six import StringIO
import pydotplus
Iris = load_iris()
X = Iris.data[:, 2:] # petal length and width
y = Iris.target
tree_clf = DecisionTreeClassifier(max_depth=2, criterion='entropy')
tree_clf.fit(X, y)
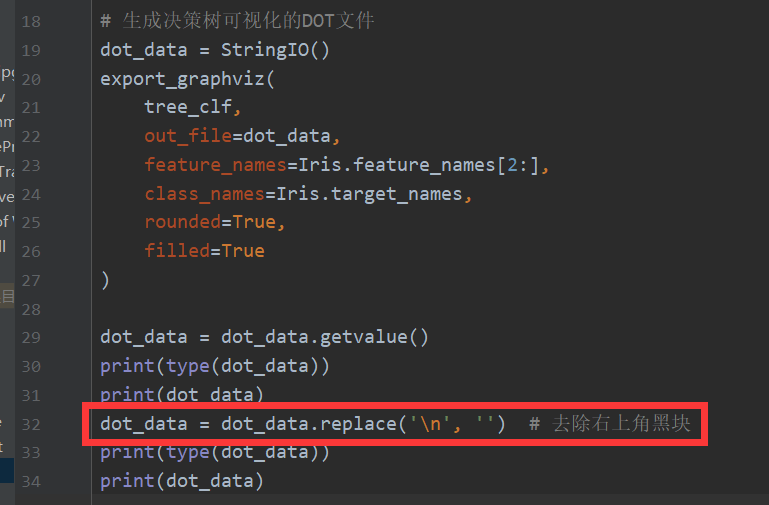
# 生成决策树可视化的DOT文件
dot_data = StringIO()
export_graphviz(
tree_clf,
out_file=dot_data,
feature_names=Iris.feature_names[2:],
class_names=Iris.target_names,
rounded=True,
filled=True
)
dot_data = dot_data.getvalue()
print(type(dot_data))
print(dot_data)
dot_data = dot_data.replace('\n', '') # 去除右上角黑块
print(type(dot_data))
print(dot_data)
graph = pydotplus.graph_from_dot_data(dot_data)
graph.write_png("output/决策树/iris_decision_tree.png")
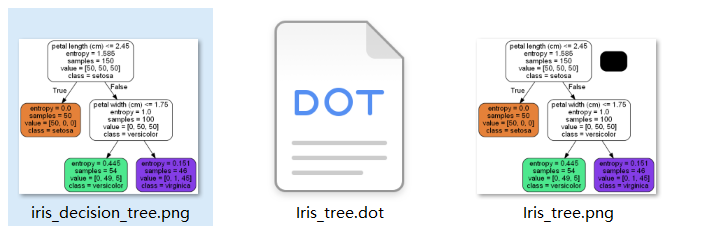
生成的图像,对比如下,可以看到右图(代码1)有个黑块:
因为之前解决过黑块问题(就是代码2),所以我在代码1里也尝试
.replace('\n', '')
发现不行。为什么?
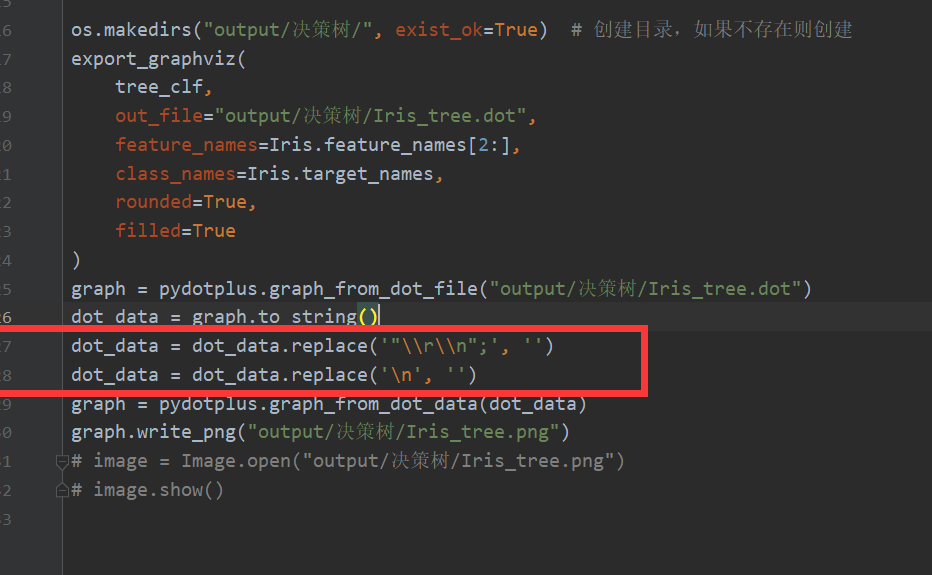
先告诉解决方法:
dot_data = dot_data.replace('"\\r\\n";', '')
dot_data = dot_data.replace('\n', '')
再告诉为什么:
请对比二者的dot_data(上图是代码1的第一次print(dot_data),下图是代码2的dot_data):
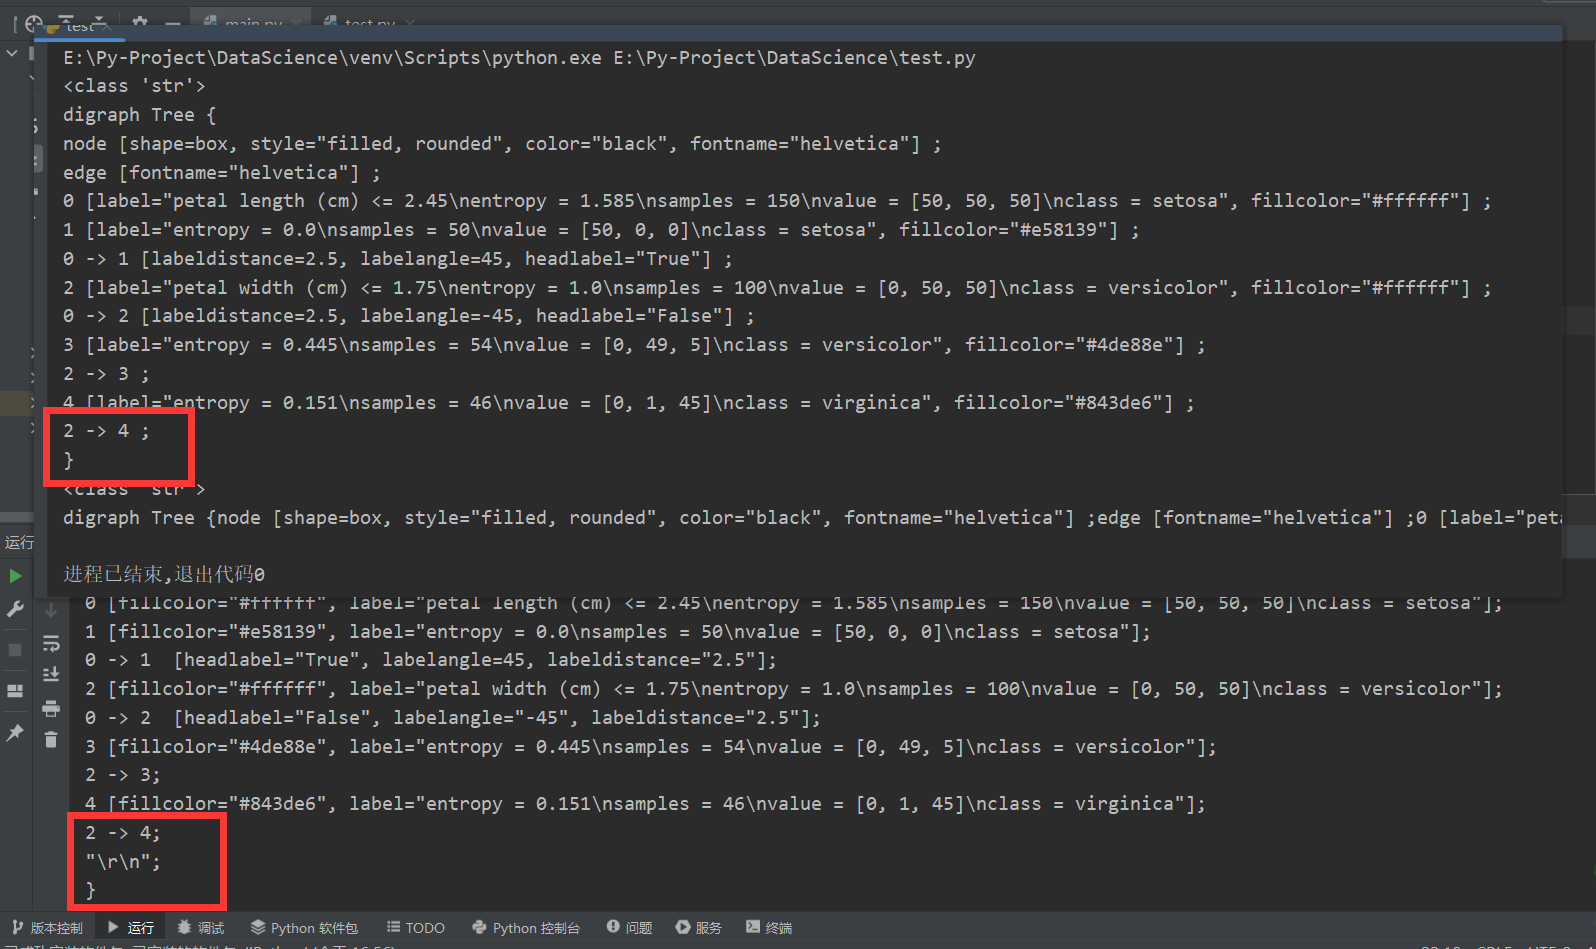
可以发现,存在本地的
dot_data
是包含了
"\r\n";
这个奇奇怪怪的东西的。
因此,需要先去除"\r\n";,也就是代码:
dot_data = dot_data.replace('"\\r\\n";', '')
然后跟IO流的一样,去除\n:
dot_data = dot_data.replace('\n', '')
也就是这样的一个转换:
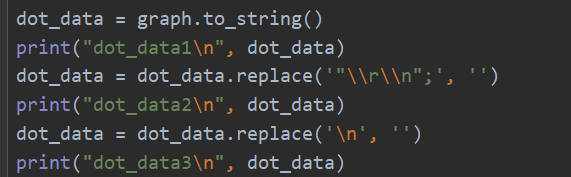
dot_data1
 digraph Tree {
node [color="black", fontname="helvetica", shape=box, style="filled, rounded"];
edge [fontname="helvetica"];
0 [fillcolor="#ffffff", label="petal width (cm) <= 0.8\nentropy = 1.585\nsamples = 150\nvalue = [50, 50, 50]\nclass = setosa"];
1 [fillcolor="#e58139", label="entropy = 0.0\nsamples = 50\nvalue = [50, 0, 0]\nclass = setosa"];
0 -> 1  [headlabel="True", labelangle=45, labeldistance="2.5"];
2 [fillcolor="#ffffff", label="petal width (cm) <= 1.75\nentropy = 1.0\nsamples = 100\nvalue = [0, 50, 50]\nclass = versicolor"];
0 -> 2  [headlabel="False", labelangle="-45", labeldistance="2.5"];
3 [fillcolor="#4de88e", label="entropy = 0.445\nsamples = 54\nvalue = [0, 49, 5]\nclass = versicolor"];
2 -> 3;
4 [fillcolor="#843de6", label="entropy = 0.151\nsamples = 46\nvalue = [0, 1, 45]\nclass = virginica"];
2 -> 4;
"\r\n";
}

dot_data2
 digraph Tree {
node [color="black", fontname="helvetica", shape=box, style="filled, rounded"];
edge [fontname="helvetica"];
0 [fillcolor="#ffffff", label="petal width (cm) <= 0.8\nentropy = 1.585\nsamples = 150\nvalue = [50, 50, 50]\nclass = setosa"];
1 [fillcolor="#e58139", label="entropy = 0.0\nsamples = 50\nvalue = [50, 0, 0]\nclass = setosa"];
0 -> 1  [headlabel="True", labelangle=45, labeldistance="2.5"];
2 [fillcolor="#ffffff", label="petal width (cm) <= 1.75\nentropy = 1.0\nsamples = 100\nvalue = [0, 50, 50]\nclass = versicolor"];
0 -> 2  [headlabel="False", labelangle="-45", labeldistance="2.5"];
3 [fillcolor="#4de88e", label="entropy = 0.445\nsamples = 54\nvalue = [0, 49, 5]\nclass = versicolor"];
2 -> 3;
4 [fillcolor="#843de6", label="entropy = 0.151\nsamples = 46\nvalue = [0, 1, 45]\nclass = virginica"];
2 -> 4;

}

dot_data3
 digraph Tree {node [color="black", fontname="helvetica", shape=box, style="filled, rounded"];edge [fontname="helvetica"];0 [fillcolor="#ffffff", label="petal width (cm) <= 0.8\nentropy = 1.585\nsamples = 150\nvalue = [50, 50, 50]\nclass = setosa"];1 [fillcolor="#e58139", label="entropy = 0.0\nsamples = 50\nvalue = [50, 0, 0]\nclass = setosa"];0 -> 1  [headlabel="True", labelangle=45, labeldistance="2.5"];2 [fillcolor="#ffffff", label="petal width (cm) <= 1.75\nentropy = 1.0\nsamples = 100\nvalue = [0, 50, 50]\nclass = versicolor"];0 -> 2  [headlabel="False", labelangle="-45", labeldistance="2.5"];3 [fillcolor="#4de88e", label="entropy = 0.445\nsamples = 54\nvalue = [0, 49, 5]\nclass = versicolor"];2 -> 3;4 [fillcolor="#843de6", label="entropy = 0.151\nsamples = 46\nvalue = [0, 1, 45]\nclass = virginica"];2 -> 4;}
需要无黑块的输出图片,就需要类似于dot_data3的输入。
IO流的不会有\r\n,因此只需要:
保存到本地的有\r\n,因此多一步:
大家可以自行print,看看与这个的不同,就知道如何避免黑块了。
因为这个的数据类型就是str,对其的操作其实是十分简单的,希望大家都能将黑块干掉!


 到【灌水乐园】发言


