I love interactive
pivot tables. That is the number one reason why I keep using spreadsheet software. The ability to look at data quickly in lots of different ways, without a single line of code helps me to get an understanding of the data really fast.
Perhaps I can do the same now in R as well. At yesterday's LondonR meeting Enzo Martoglio presented briefly his
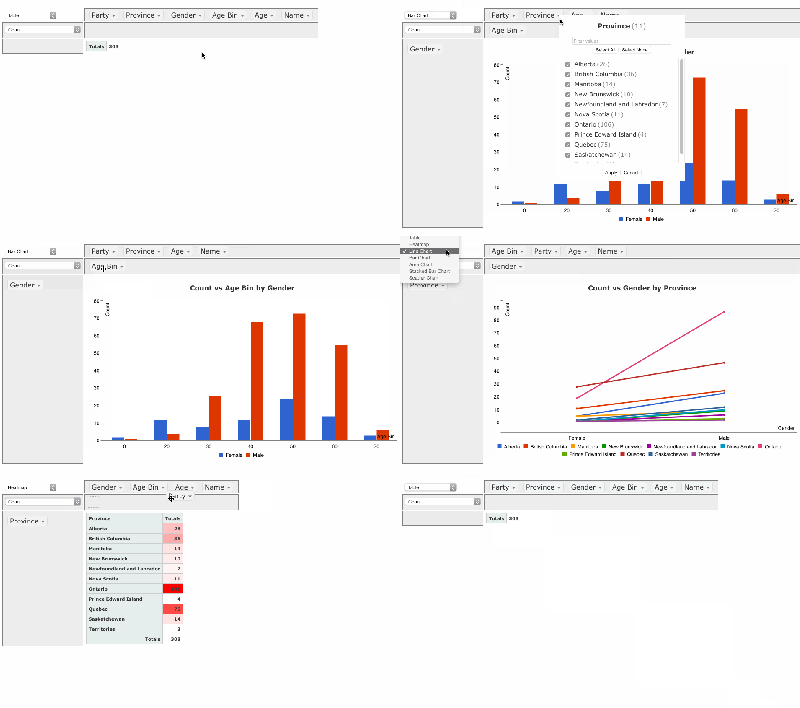
The following animated Gif from Nicolas' project page gives an idea of the interactive functionality of PivotTable.js.
Perhaps I can do the same now in R as well. At yesterday's LondonR meeting Enzo Martoglio presented briefly his
rpivotTable package. Enzo builds on
Nicolas Krutchen's
PivotTable.js JavaScript library that provides drag'n'drop functionality and wraps it with
htmlwidget into R. The result is an interactive pivot table rendered in either your default browser or the viewer pane of RStudio with one line of code:
## Install packages
library(devtools)
install_github("ramnathv/htmlwidgets")
install_github("smartinsightsfromdata/rpivotTable")
## Load rpivotTable
library(rpivotTable)
data(mtcars)
## One line to create pivot table
rpivotTable(mtcars, rows="gear", col="cyl", aggregatorName="Average",
vals="mpg", rendererName="Treemap")
The following animated Gif from Nicolas' project page gives an idea of the interactive functionality of PivotTable.js.
 |
| Example of PivotTable.js Source: Nicolas Kruchten |
Session Info
R version 3.1.3 (2015-03-09)
Platform: x86_64-apple-darwin13.4.0 (64-bit)
Running under: OS X 10.10.2 (Yosemite)

locale:
[1] en_GB.UTF-8/en_GB.UTF-8/en_GB.UTF-8/C/en_GB.UTF-8/en_GB.UTF-8

attached base packages:
[1] stats     graphics  grDevices utils
[5] datasets  methods   base

other attached packages:
[1] rpivotTable_0.1.3.4

loaded via a namespace (and not attached):
[1] digest_0.6.8      htmltools_0.2.6
[3] htmlwidgets_0.3.2 RJSONIO_1.3-0
[5] tools_3.1.3       yaml_2.1.13


 本文介绍了如何使用R语言中的rpivotTable包创建交互式透视表,提供了一种快速理解和分析数据的方式,演示了从安装所需包到创建透视表的全过程。


 1078
1078

 被折叠的 条评论
为什么被折叠?


