


一、前言
想要实现的效果是,每秒钟动态获取后台数据,进行显示,在网上找了下,先看了下Echarts的效果:http://echarts.baidu.com/examples/editor.html?c=dynamic-data2
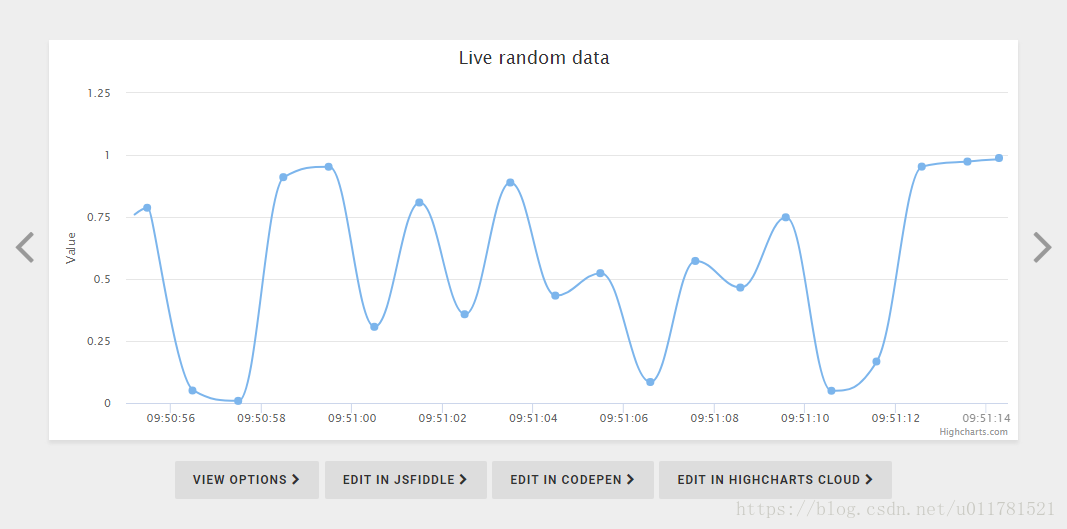
这种效果,还行,我想显示的有3条数据,然后又看下了Highcharts,发现了他也有这种效果:
https://www.highcharts.com/demo/dynamic-update
然后我在他的示例上修改成了如下:
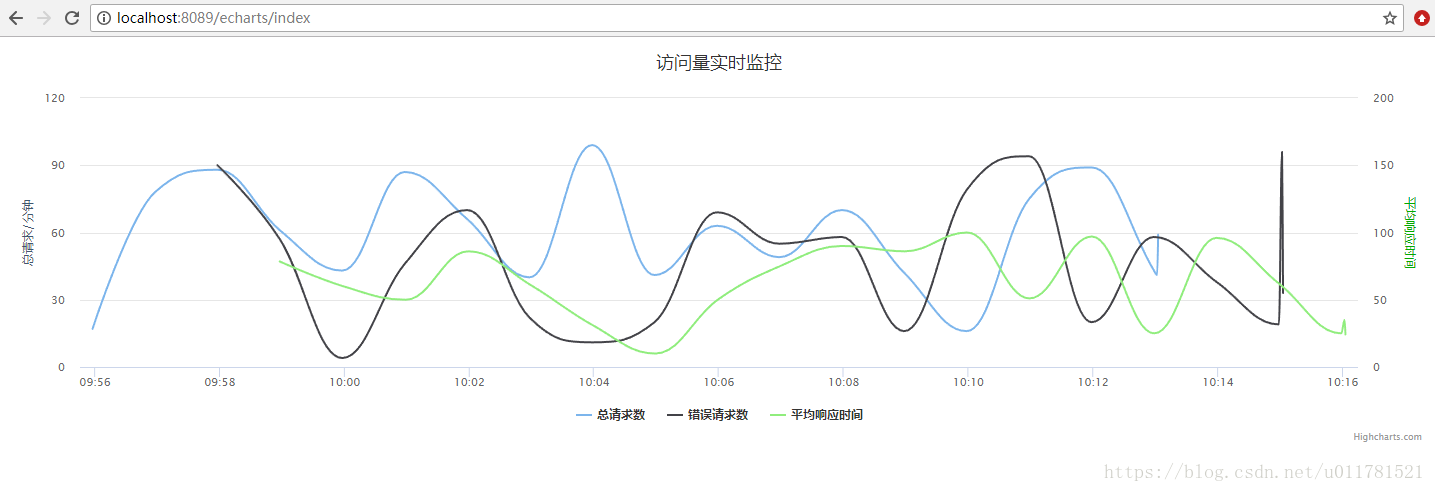
两个Y轴显示文字。
二、源码
代码如下:
<!DOCTYPE HTML>
<html>
<head>
    <meta http-equiv="Content-Type" content="text/html; charset=utf-8">
    <meta name="viewport" content="width=device-width, initial-scale=1">
    <title>Highcharts Example</title>
    <style type="text/css">
    </style>
</head>
<body>
<script src="https://code.jquery.com/jquery-3.1.1.min.js"></script>
<script src="${ctxPath}/static/code/highcharts.js"></script>
<script src="${ctxPath}/static/code/modules/exporting.js"></script>
<script src="${ctxPath}/static/code/modules/export-data.js"></script>

<div id="container" style="min-width: 310px; height: 400px; margin: 0 auto"></div>

<script type="text/javascript">
    Highcharts.setOptions({
        global: {
            useUTC: false
        }
    });
    var max=6;
    Highcharts.chart('container', {
        chart: {
            type: 'spline',
            animation: Highcharts.svg,
            events: {
                load: function() {
                    var series = this.series;
                    var loadData = function() {
                        $.getJSON("http://localhost:8089/echarts/vintage", function(data) {
                            for (var k = 0; k < series.length; k++) {
                                console.info(data.length)
                                for (var j = 0; j < data[k].length; j++) {
                                    var point = data[k][j];
                                    console.info(point)
                                    console.info(point[0])
                                    console.info(point[1])
                                    var isShift = series[k].data.length >= max;
                                    console.log("series " + k + ".data.length=" + series[k].data.length);
                                    var lastTime = 0;
                                    if (series[k].data.length > 0)
                                        lastTime = series[k].data[series[k].data.length - 1].x;
                                    if (point[0] > lastTime)
                                        series[k].addPoint([point[0],point[1]], true, isShift);
                                }
                            }
                        })
                    };
                    loadData();
                    setInterval(loadData, 1000);
                }
            }
        },
        title: {
            text: '访问量实时监控'
        },
        xAxis: [
            {
                type: 'datetime',
                tickPixelInterval: 120
            }
        ],
        yAxis: [
            {
                title: {
                    text: '总请求/分钟',
                    style: {
                        color: '#3E576F'
                    }
                }
            },
            {
                title: {
                    text: '平均响应时间',
                    style: {
                        color: '#00AA00'
                    }
                },opposite:true
            }
        ],
        plotOptions: {
            spline: {
                marker:{
                    enabled: false,
                    states: {
                        hover: {
                            enabled: true,
                            symbol: 'circle',
                            radius: 5,
                            lineWidth: 1
                        }
                    }
                }
            }
        },
        tooltip: {
            formatter: function() {
                return '<b>' + this.series.name + '</b><br/>' +
                    Highcharts.dateFormat('%Y-%m-%d %H:%M:%S', this.x) + '<br/>' +
                    Highcharts.numberFormat(this.y, 2);
            }
        },
        legend: {
            enabled: true
        },
        exporting: {
            enabled: false
        },
        series: [
            {
                name: '总请求数',
                data: [{x: 1535549581766, y: 8.255385961269337},
                    {x: 1535549582766, y: 8.522856658860768},
                    {x: 1535549583766, y: 8.85224288300491},
                    {x: 1535549584766, y: 8.203602150586137},
                    {x: 1535549585766, y: 8.830985714653746},
                    {x: 1535549586766, y: 8.648804185628615},
                    {x: 1535549587766, y: 8.54365631703881},
                    {x: 1535549588766, y: 8.183473493411935},
                    {x: 1535549589766, y: 8.107250381815213},
                    {x: 1535549590766, y: 8.674642595370756},
                    {x: 1535549591766, y: 8.875834458275218},
                    {x: 1535549592766, y: 8.104192236371079},
                    {x: 1535549593766, y: 8.273510688961343},
                    {x: 1535549594766, y: 8.698645044397763},
                    {x: 1535549595766, y: 8.630132546505347},
                    {x: 1535549596766, y: 8.19276234585974},
                    {x: 1535549597766, y: 8.202379301534918},
                    {x: 1535549598766, y: 8.888758703470918},
                    {x: 1535549599766, y: 8.840359577742495},
                    {x: 1535551504135, y: 8.965286133918756}]
            },
            {
                name: '错误请求数',
                data: [{x: 1535549581768, y: 5.631470025269889},
                    {x: 1535549582768, y: 5.80833150333066},
                    {x: 1535549583768, y: 5.615057046709662},
                    {x: 1535549584768, y: 5.608928585842969},
                    {x: 1535549585768, y: 5.153605115523144},
                    {x: 1535549586768, y: 5.438982653534119},
                    {x: 1535549587768, y: 5.434254193425316},
                    {x: 1535549588768, y: 5.233764563045739},
                    {x: 1535549589768, y: 5.066078696056088},
                    {x: 1535549590768, y: 5.402066058377414},
                    {x: 1535549591768, y: 5.115167367142142},
                    {x: 1535549592768, y: 5.569563848237927},
                    {x: 1535549593768, y: 5.3771521799030895},
                    {x: 1535549594768, y: 5.557674673748734},
                    {x: 1535549595768, y: 5.779198450582005},
                    {x: 1535549596768, y: 5.024568401355755},
                    {x: 1535549597768, y: 5.999943168524271},
                    {x: 1535549598768, y: 5.3633974314345725},
                    {x: 1535549599768, y: 5.152136232686349},
                    {x: 1535549600768, y: 5.497676337112302}]
            },
            {
                name: '平均响应时间',
                yAxis:1,
                data: [{x: 1535549581770, y: 2.9063965576357296},
                    {x: 1535549582770, y: 2.115102850799488},
                    {x: 1535549583770, y: 2.295125026581167},
                    {x: 1535549584770, y: 2.5839580878751627},
                    {x: 1535549585770, y: 2.41973580817432},
                    {x: 1535549586770, y: 2.2324255066003476},
                    {x: 1535549587770, y: 2.877080909195574},
                    {x: 1535549588770, y: 2.670387619876992},
                    {x: 1535549589770, y: 2.8328323536321003},
                    {x: 1535549590770, y: 2.4492166897167564},
                    {x: 1535549591770, y: 2.2960889540892544},
                    {x: 1535549592770, y: 2.4254398993593957},
                    {x: 1535549593770, y: 2.9139794370919248},
                    {x: 1535549594770, y: 2.2363677342947907},
                    {x: 1535549595770, y: 2.7774917450101677},
                    {x: 1535549596770, y: 2.8122490928540937},
                    {x: 1535549597770, y: 2.3611332533125644},
                    {x: 1535549598770, y: 2.2739320663864726},
                    {x: 1535549599770, y: 2.9702427114600276},
                    {x: 1535549600770, y: 2.470969458860716}]
            }
        ]
    });
</script>

</body>
</html>
后台模拟了一个简单的数据:
    @GetMapping("vintage")
    @ResponseBody
    public List<List<List<Long>>> vintage(){
        List<List<List<Long>>> resultList = Lists.newArrayList();
        List<List<Long>> oneList = Lists.newArrayList();
        List<List<Long>> twoList = Lists.newArrayList();
        List<List<Long>> shoList = Lists.newArrayList();
        SimpleDateFormat sdf = new SimpleDateFormat("yyyy-MM-dd HH:mm:ss");
        Date now = new Date();
        for (int i = 0; i < 20; i++) {
            Calendar nowTime = Calendar.getInstance();
            nowTime.add(Calendar.MINUTE, i);
            List<Long> ss = Lists.newArrayList();
            ss.add(nowTime.getTimeInMillis());
            ss.add(new Long((long)getRandom(100,i)));
            oneList.add(ss);
            System.out.println(sdf.format(nowTime.getTime()));
        }
        resultList.add(oneList);
        for (int i = 0; i < 20; i++) {
            Calendar nowTime = Calendar.getInstance();
            nowTime.add(Calendar.MINUTE, i+2);
            List<Long> ss = Lists.newArrayList();
            ss.add(nowTime.getTimeInMillis());
            ss.add(new Long((long)getRandom(100,i)));
            twoList.add(ss);
            System.out.println(sdf.format(nowTime.getTime()));
        }
        resultList.add(twoList);

        for (int i = 0; i < 20; i++) {
            Calendar nowTime = Calendar.getInstance();
            nowTime.add(Calendar.MINUTE, i+3);
            List<Long> ss = Lists.newArrayList();
            ss.add(nowTime.getTimeInMillis());
            ss.add(new Long((long)getRandom(100,i)));
            shoList.add(ss);
            System.out.println(sdf.format(nowTime.getTime()));
        }
        resultList.add(shoList);

        return resultList;
    }

    public int getRandom(int max,int min){
        Random random = new Random();
        int s = random.nextInt(max)%(max-min+1) + min;
        System.out.println(s);
        return s;
    }
这个有个问题是数据初始化:
    series: [{
        name: 'Random data',
        data: (function () {
            // generate an array of random data
            var data = [],
                time = (new Date()).getTime(),
                i;

            for (i = -19; i <= 0; i += 1) {
                data.push({
                    x: time + i * 1000,
                    y: Math.random()
                });
            }
            return data;
        }())
    }]
如果series为空的话,在load: function ()中如果有数据的话,好像不能正常显示,所以需要在series也要初始化下数据,最终修改成如下:
<!DOCTYPE HTML>
<html>
<head>
    <meta http-equiv="Content-Type" content="text/html; charset=utf-8">
    <meta name="viewport" content="width=device-width, initial-scale=1">
    <title>Highcharts Example</title>

    <style type="text/css">

    </style>
</head>
<body>
<script src="https://code.jquery.com/jquery-3.1.1.min.js"></script>
<script src="${ctxPath}/static/code/highcharts.js"></script>
<script src="${ctxPath}/static/code/modules/exporting.js"></script>
<script src="${ctxPath}/static/code/modules/export-data.js"></script>

<div id="container" style="min-width: 310px; height: 400px; margin: 0 auto"></div>


<script type="text/javascript">

    function create() {
        var series = new Array();
        $.ajax({
            type: "GET",
            url: "http://localhost:8089/echarts/vintage",
            async: false, //表示同步,如果要得到ajax处理完后台数据后的返回值,最好这样设置
            success: function (data) {
                for (var k = 0; k < 3; k++) {
                    var seriesData = [];
                    for (var j = 0; j < data[k].length; j++) {
                        var point = data[k][j];
                        var time = point[0];
                        var value = point[1];
                        seriesData.push({
                            x: time,
                            y: value
                        });
                    }
                    if (k == 0) {
                        series.push({"name": "总请求数",color: '#4572A7',type: 'spline',yAxis:0, "data": seriesData});
                    } else if (k == 1) {
                        series.push({"name": "错误请求数", "data": seriesData});
                    } else {
                        series.push({"name": "平均响应时间", color: '#89A54E',type: 'spline',yAxis:1, "data": seriesData});
                    }
                }
            }
        }, false);  //false表示“遮罩”,前台不显示“请稍后”进度提示
        return series;
    }

    Highcharts.setOptions({
        global: {
            useUTC: false
        }
    });
    var max = 6;
    Highcharts.chart('container', {
        chart: {
            type: 'spline',
            // animation: Highcharts.svg, // don't animate in old IE
            // marginRight: 10,
            zoomType: 'xy', //双Y轴刻度
            events: {
                load: function () {
                    var series = this.series;
                    var loadData = function () {
                        $.getJSON("http://localhost:8089/echarts/vintage", function (data) {
                            for (var k = 0; k < series.length; k++) {
                                console.info(data.length)
                                for (var j = 0; j < data[k].length; j++) {
                                    var point = data[k][j];
                                    console.info(point)
                                    console.info(point[0])
                                    console.info(point[1])
                                    var isShift = series[k].data.length >= max;
                                    console.log("series " + k + ".data.length=" + series[k].data.length);
                                    var lastTime = 0;
                                    if (series[k].data.length > 0)
                                        lastTime = series[k].data[series[k].data.length - 1].x;
                                    if (point[0] > lastTime)
                                        series[k].addPoint([point[0], point[1]], true, isShift);
                                }
                            }
                        })
                    };
                    loadData();
                    setInterval(loadData, 1000);
                }
            }
        },
        title: {
            text: '访问量实时监控'
        },
        xAxis: [
            {
                type: 'datetime',
                tickPixelInterval: 120
            }
        ],
        yAxis: [
            {
                title: {
                    text: '总请求/分钟',
                    style: {
                        color: '#3E576F'
                    }
                }
            },
            {
                title: {
                    text: '平均响应时间',
                    style: {
                        color: '#00AA00'
                    }
                },
                opposite:true
            }
        ],
        //图例样式设置
        legend: {
            layout: 'vertical',
            align: 'left',
            x: 0,
            verticalAlign: 'top',
            y: 0,
            floating: true,
            backgroundColor: '#FFFFFF'
        },
        tooltip: {
            formatter: function () {
                return '<b>' + this.series.name + '</b><br/>' +
                    Highcharts.dateFormat('%Y-%m-%d %H:%M:%S', this.x) + '<br/>' +
                    Highcharts.numberFormat(this.y, 2);
            }
        },
        legend: {
            enabled: true
        },
        exporting: {
            enabled: false
        },
        series: create()
    });
</script>

</body>
</html>


 571
571

 被折叠的 条评论
为什么被折叠?
被折叠的 条评论
为什么被折叠?
 到【灌水乐园】发言


