


 本文通过Python的matplotlib库展示了如何绘制基本的线性图表和饼状图。线性图表使用了50个点的正弦曲线,并以蓝色带星虚线的形式呈现;饼状图则展示了不同类别占比,并通过explode参数强调了特定部分。
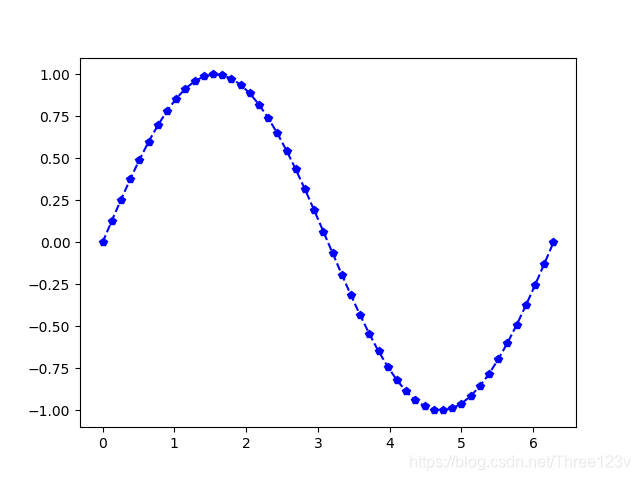
线性二维图
import numpy as np
import matplotlib.pyplot as  plt
plt.figure()
x=np.linspace(0,2*np.pi,50)
y=np.sin(x)
plt.plot(x,y,'bp--')#蓝色带星虚线
plt.show()
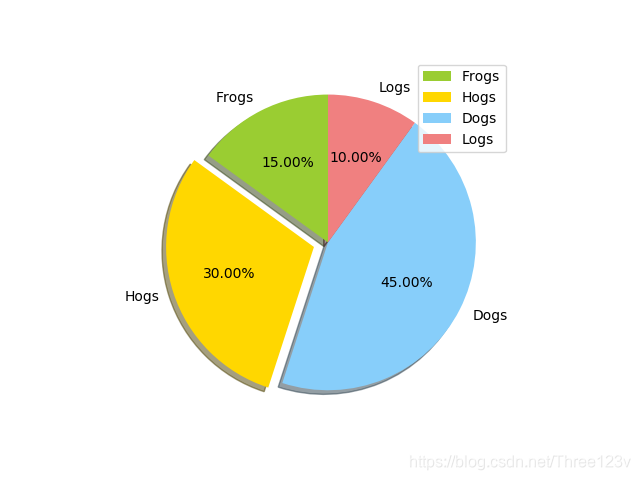
饼型图
import matplotlib.pyplot as plt
label = ['Frogs', 'Hogs', 'Dogs', 'Logs']
sizes= [15,30,45,10]
explode=(0,0.1,0,0)
colors=['yellowgreen','gold','lightskyblue','lightcoral']#coral珊瑚
plt.pie(sizes,labels=label,explode=explode,colors=colors, autopct='%1.2f%%',shadow=True,startangle=90)
plt.axis=('equal')
plt.legend()
plt.show()


 1053
1053

 被折叠的 条评论
为什么被折叠?
被折叠的 条评论
为什么被折叠?
 到【灌水乐园】发言


