


 IE Developer Toolbar是一款用于辅助Web开发者理解网页结构的工具。它能够帮助用户探索并修改DOM,选择特定元素,禁用IE设置,查看HTML对象名称、ID及详细信息如链接路径、Tab索引值和访问键。此外,还可以验证HTML、CSS、WAI和RSS链接,展示图像尺寸、文件大小、路径信息及替代文本。
原文:http://hi.baidu.com/hfly/blog/item/6285733111f1a11cebc4af94.html
建议Web程序开发者安装这个程序。
功能包括显示View DOM,禁用缓存、图片、Cookies及Script,查看页面的Class及Id信息、链接地址、Tab Indexes,标示Tables, Div等页面元素,对页面进行W3C标准验证,切换浏览器分辩率,清空当前域名的缓存、Session Cookies等。
The Internet Explorer Developer Toolbar provides several features for exploring and understanding Web pages. These features enable you to:
- Explore and modify the document object model (DOM) of a Web page.
- Locate and select specific elements on a Web page through a variety of techniques.
- Selectively disable Internet Explorer settings.
- View HTML object class names, ID's, and details such as link paths, tab index values, and access keys.
- Outline tables, table cells, images, or selected tags.
- Validate HTML, CSS, WAI, and RSS web feed links.
- Display image dimensions, file sizes, path information, and alternate (ALT) text.
- Immediately resize the browser window to a new resolution.
- Selectively clear the browser cache and saved cookies. Choose from all objects or those associated with a given domain.
- Display a fully featured design ruler to help accurately align and measure objects on your pages.
- Find the style rules used to set specific style values on an element.
- View the formatted and syntax colored source of HTML and CSS
点击这里进入官方介绍及下载页面。
安装好后,我们会发现IE的标准按键上面多了一个

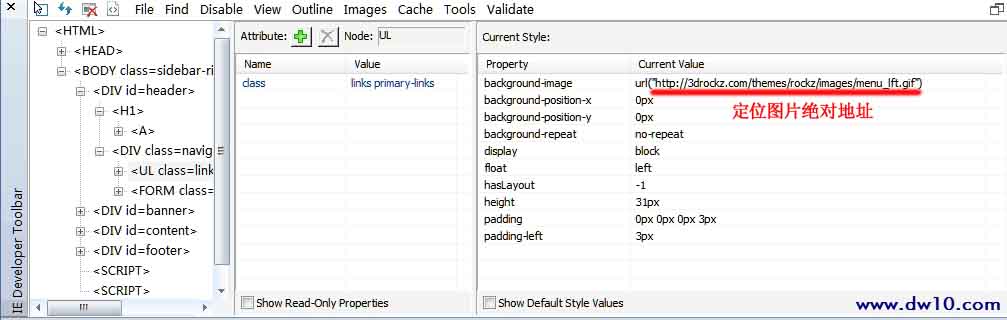
其使用情况如下所示
在Firfox浏览器下面也有一个相应的插件叫做FireBug!


 1311
1311

 被折叠的 条评论
为什么被折叠?
被折叠的 条评论
为什么被折叠?
 到【灌水乐园】发言


