


1.新建图形窗口,设置其标题为“对数函数的图像”,在该窗口中绘制对数函数f=lnx在区间0<x<10内的图像
fh=figure("name",'对数函数的图像') ;
title('对数函数的图像');
f=@(x)log(x);
fplot(f,[0,10])
2.编写程序,实现如下功能:创建图形窗口,并设置其默认背景色为黄色、默认线宽为4个像素,在该窗口中绘制椭圆 的图像,其中a和b任选。
3.编写MAT
a1=input('请输入:a=','s')
b1=input('请输入:b=','s')
a=str2num(a1);
b=str2num(b1);
x(t)=a*cos(t);
y(t)=b*sin(t);
h=ezplot(x(t),y(t));
set(gcf,'color','y');
set(h,'LineWidth',4);
LAB程序,绘制下面的函数: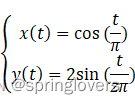 ,其中-2≤t≤2
该程序在绘制图形之后等待用户的鼠标输入,每单击其中一条曲线,就随机修改该曲线的颜色,包括红色、绿色、蓝色、黑色、黄色。
figure;
syms t;
x(t)=cos(t/pi);
y(t)=2*sin(t/(2*pi));
fh=ezplot(x(t),y(t),[-2,2]);
h=gco(fh);

w = waitforbuttonpre
最低0.47元/天 解锁文章


 1774
1774

 被折叠的 条评论
为什么被折叠?
被折叠的 条评论
为什么被折叠?
 到【灌水乐园】发言


