


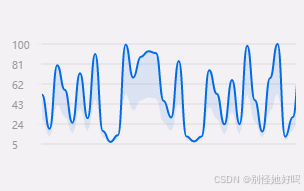
由于项目包太大没法引入echarts,参考各种资料实现了需要的效果,数据实时更新向左平滑滚动,不会重新加载闪烁。
子组件
<template>
  <view>
    <canvas style="width:100%;height: 200px;margin:0 0;" :style="style" canvas-id="lineCanvas" id="lineCanvas"></canvas>
  </view>
</template>

<script>
export default {
  props: {
    chartData: {
      type: Array,
      default: () => []
    },
    maxDataPoints: {
      type: Number,
      default: 10
    },
    animationDuration: {
      type: Number,
      default: 300
    },
    color: {
      type: String,
      default: 'red'
    },
	shadowColor: {
	  type: String,
	  default: 'rgba(255, 0, 0, 0.2)'
	},
    setStyle: {
      type: Object,
      default: () => ({
        marginLeft: "0",
        width: "95%"
      })
    }
  },
  data() {
    return {
      canvas: null,
      ctx: null,
      width: 0,
      height: 0,
      xStep: 0,
      data: [],
      animationStartTime: null,
      intervalId: null,
      style: '',
      isCtxInitialized: false,
      xTickInterval: 2, // 设置 x 轴刻度显示间隔
      yGridColor: 'rgba(0, 0, 0, 0.1)', // y 轴分割线颜色
       yTextColor: '#999' // y 轴文字颜色
    };
  },
  watch: {
    chartData: {
      handler(newData) {
        if (this.isCtxInitialized) {
          this.data = newData.slice();
          this.animationStartTime = Date.now();
          this.animateChart();
        }
      },
      deep: true
    }
  },
  onReady() {
    this.setStyleFn();
    this.initData();
  },
  beforeDestroy() {
    clearInterval(this.intervalId);
  },
  methods: {
    // 设置图表大小
    setStyleFn() {
      this.style = `margin-left:${this.setStyle.marginLeft}; width:${this.setStyle.width};`
      setTimeout(() => {
        this.getDescBox();
      }, 0)
    },
    // 获取canvas容器
    getDescBox() {
      uni.createSelectorQuery().in(this).select(`#lineCanvas`).boundingClientRect(result => {
        if (result) {
          this.canvasWidth = result.width;
          this.width = result.width;
          this.height = result.height;
          // 计算 xStep
          this.xStep = this.width / this.maxDataPoints;
          // 初始化 canvas 上下文
          this.ctx = uni.createCanvasContext('lineCanvas', this);
          this.isCtxInitialized = true;
          this.drawChart();
        } else {
          this.getDescBox();
        }
      }).exec();
    },
    initData() {
      this.data = this.chartData.slice();
    },
    animateChart() {
      const currentTime = Date.now();
      const elapsedTime = currentTime - this.animationStartTime;
      if (elapsedTime < this.animationDuration) {
        const progress = elapsedTime / this.animationDuration;
        this.drawChart(progress);
        // 使用 setTimeout 模拟 requestAnimationFrame
        setTimeout(() => {
          this.animateChart();
        }, 16); // 约 60fps
      } else {
        this.drawChart(1);
      }
    },
    drawChart(progress = 1) {
      if (this.ctx) {
        this.ctx.clearRect(0, 0, this.width, this.height);
        this.drawAxes();
        this.drawYGrid(); // 绘制 y 轴分割线
        this.drawShadow(progress); // 绘制阴影
        this.drawLine(progress);
        this.ctx.draw(true)
      }
    },
    drawAxes() {
      this.ctx.strokeStyle = '#eee';
      // 绘制 y 轴刻度和标注
      const yMax = Math.max(...this.data);
      const yMin = Math.min(...this.data);
      const yRange = yMax - yMin;
      const yTickCount = 5; // y 轴刻度数量
      const yTickStep = (this.height - 100) / yTickCount;
      for (let i = 0; i <= yTickCount; i++) {
        const y = this.height - 50 - i * yTickStep;
        // 绘制刻度线
        this.ctx.beginPath();
        this.ctx.moveTo(50, y);
        this.ctx.lineTo(45, y);
		this.ctx.fillStyle = this.yTextColor;
        this.ctx.stroke();
        // 计算刻度值
        const tickValue = yMin + (yRange * i / yTickCount);
        // 绘制刻度标注
        this.ctx.fillText(tickValue.toFixed(0), 20, y + 5);
      }
    },
    drawYGrid() {
      const yMax = Math.max(...this.data);
      const yMin = Math.min(...this.data);
      const yRange = yMax - yMin;
      const yTickCount = 5; // y 轴刻度数量
      const yTickStep = (this.height - 100) / yTickCount;

      this.ctx.strokeStyle = this.yGridColor;
      this.ctx.lineWidth = 1;

      for (let i = 0; i <= yTickCount; i++) {
        const y = this.height - 50 - i * yTickStep;
        this.ctx.beginPath();
        this.ctx.moveTo(50, y);
        this.ctx.lineTo(this.width, y);
        this.ctx.stroke();
      }
    },
    drawShadow(progress) {
      const yMax = Math.max(...this.data);
      const yMin = Math.min(...this.data);
      const yRange = yMax - yMin;
      const offset = this.xStep * (1 - progress);

      this.ctx.beginPath();
      for (let i = 0; i < this.data.length; i++) {
        const x = 50 + i * this.xStep + offset;
        const y = this.height - 50 - ((this.data[i] - yMin) / yRange) * (this.height - 100);
        if (i === 0) {
          this.ctx.moveTo(x, y);
        } else {
          const prevX = 50 + (i - 1) * this.xStep + offset;
          const prevY = this.height - 50 - ((this.data[i - 1] - yMin) / yRange) * (this.height - 100);
          const cpX = (prevX + x) / 2;
          const cpY1 = prevY;
          const cpY2 = y;
          this.ctx.bezierCurveTo(cpX, cpY1, cpX, cpY2, x, y);
        }
      }
      // 连接到折线 y 坐标与 x 轴 y 坐标的中间位置
      for (let i = this.data.length - 1; i >= 0; i--) {
        const x = 50 + i * this.xStep + offset;
        const y = this.height - 50 - ((this.data[i] - yMin) / yRange) * (this.height - 100);
        const halfY = y + (this.height - 50 - y) / 2;
        if (i === this.data.length - 1) {
          this.ctx.lineTo(x, halfY);
        } else {
          const nextX = 50 + (i + 1) * this.xStep + offset;
          const nextHalfY = this.height - 50 - ((this.data[i + 1] - yMin) / yRange) * (this.height - 100) + (this.height - 50 - (this.height - 50 - ((this.data[i + 1] - yMin) / yRange) * (this.height - 100))) / 2;
          const cpX = (nextX + x) / 2;
          const cpY1 = nextHalfY;
          const cpY2 = halfY;
          this.ctx.bezierCurveTo(cpX, cpY1, cpX, cpY2, x, halfY);
        }
      }
      this.ctx.closePath();

      this.ctx.fillStyle = this.shadowColor;
      this.ctx.fill();
    },
    drawLine(progress) {
      const yMax = Math.max(...this.data);
      const yMin = Math.min(...this.data);
      const yRange = yMax - yMin;
      // 修改偏移量计算,让图表向右滚动
      const offset = this.xStep * (1 - progress);

      this.ctx.beginPath();
      for (let i = 0; i < this.data.length; i++) {
        const x = 50 + i * this.xStep + offset;
        const y = this.height - 50 - ((this.data[i] - yMin) / yRange) * (this.height - 100);
        if (i === 0) {
          this.ctx.moveTo(x, y);
        } else {
          const prevX = 50 + (i - 1) * this.xStep + offset;
          const prevY = this.height - 50 - ((this.data[i - 1] - yMin) / yRange) * (this.height - 100);
          const cpX = (prevX + x) / 2;
          const cpY1 = prevY;
          const cpY2 = y;
          this.ctx.bezierCurveTo(cpX, cpY1, cpX, cpY2, x, y);
        }
      }
      this.ctx.strokeStyle = this.color;
      this.ctx.lineWidth = 2;
      this.ctx.stroke();
    }
  }
};
</script>
父组件引用
<template>
  <view>
    <LineChart :chartData="data" :maxDataPoints="40" :animationDuration="300" color="#006BE6" shadowColor="rgba(0,107,230,0.1)"/>
  </view>
</template>

<script>
import LineChart from './LineChart.vue';

export default {
  components: {
    LineChart
  },
  data() {
    return {
      data: []
    };
  },
  onReady() {
    this.initData();
	setInterval(()=>{
		this.updateData()
	},1000)
  },
  methods: {
    initData() {
      for (let i = 0; i < 40; i++) {
        this.data.push(Math.random() * 100);
      }
    },
    updateData() {
      this.data.shift();
      this.data.push(Math.random() * 100);
    }
  }
};
</script>


 8139
8139

 被折叠的 条评论
为什么被折叠?
被折叠的 条评论
为什么被折叠?
 到【灌水乐园】发言


