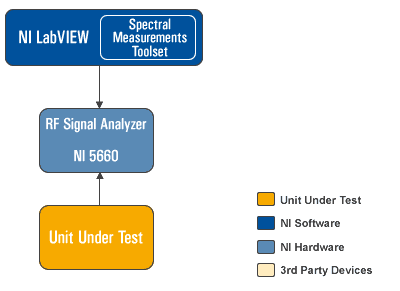
I-Q analysis of frequency-domain signals, particularly in communications applications, is a valuable tool to better understand the signal of interest. Because any RF signal can be represented by: z(t) = I(t)*cost(wt) - Q(t)*sin(wt), where I(t) and Q(t) represent the baseband terms, a modulated signal can be represented by s(t)=I(t) + jQ(t). Because of this relationship, devices that transmit modulated signals create I and Q data sets which can then be upconverted or mixed with carrier signals to create the desired RF-modulated signal. To analyze these devices, it is very valuable to extract I and Q data from the RF signal and make measurements that can provide valuable insight into the underlying design. Making I-Q measurements requires having simultaneous time and frequency data sets, which is difficult using traditional RF instruments because of their narrow resolution bandwidth filters. In contrast the NI PXI-5660 RF signal analyzer uses a 20 MHz broadband, vector-based architecture to acquire RF signals. This instrument acquires data in the time domain and brings this data into the PC as such. Then, the Spectral Measurements Toolset takes over to deliver powerful I-Q analysis. The Spectral Measurements Toolset performs an FFT on the time-domain data while preserving the original data. It then takes the resulting time and frequency domain data sets and applies algorithms to extract I and Q data from these. The Spectral Measurements Toolset allows the user to view I vs. Q, as well as I and Q vs. time, using the original time-domain data.
Related Links:
PXI-5660 RF Signal Analyzer Interactive Tutorial


 3738
3738

 被折叠的 条评论
为什么被折叠?


