


最近开发的项目中有对数据进行柱状图展示的功能要求,维护的项目里也有类似的功能需求,是使用qcustomplot这个库实现的,这次对于这个功能也使用这个库来实现,对此做一下简单记录,方便以后查阅。
这个控件功能比较强大,使用也比较方便,不仅可以绘制柱状图,还可以绘制曲线等,这里仅记录绘制柱状图过程中可能使用的接口,更多接口的使用可以参考qcustomplot官网。
1.添加从官网下载的两个文件(qcustomplot.h,qcustomplot.cpp)到QtGUI项目目录,添加完成后添加我们可以添加一个Widget控件,控件添加完成后,右键将控件提升为Qcustomplot。这样我们就可以在项目里正常使用了。
头文件
#ifndef WIDGET_H
#define WIDGET_H

#include <QWidget>
#include "qcustomplot.h"
namespace Ui {
class Widget;
}

class Widget : public QWidget
{
    Q_OBJECT

public:
    explicit Widget(QWidget *parent = 0);
    ~Widget();

private:
    Ui::Widget *ui;

    QCPBars* m_bar;
};

#endif // WIDGET_H
源文件
#include "widget.h"
#include "ui_widget.h"

Widget::Widget(QWidget *parent) :
    QWidget(parent),
    ui(new Ui::Widget)
{
    ui->setupUi(this);
    //设置X坐标轴信息
    QVector<double> ticks; //要显示的刻度
    QVector<QString> labels;//要显示的刻度的下标
    for(int i = 1; i <= 10; i++)
    {
        if(i%2==0)
        {
            ticks<<i;
            labels<<QString::number(i);
        }
    }
    ui->Plot->xAxis->setAutoTicks(false); //禁用自动刻度-如果不禁用就无法设置自定义刻度
    ui->Plot->xAxis->setAutoTickLabels(false);//禁用自动刻度标签
    ui->Plot->xAxis->setTickVector(ticks);//设置要显示的刻度
    ui->Plot->xAxis->setTickVectorLabels(labels);//设置要显示刻度的下标
    ui->Plot->xAxis->setSubTickCount(0); //设置两个刻度之间是否
    ui->Plot->xAxis->setTickLength(2,2);//设置刻度长度,第一个是向内的长度,第二个是向外的长度
    ui->Plot->xAxis->setRange(0,11); //设置坐标轴范围

    //y轴同理,这里简单设置一下

    ui->Plot->yAxis->setNumberFormat("f");
    ui->Plot->yAxis->setNumberPrecision(1);
    ui->Plot->yAxis->setTickLength(1,0);
    ui->Plot->yAxis->setRange(0,12);

    //实例化QCPBars
    m_bar = new QCPBars(ui->Plot->xAxis,ui->Plot->yAxis);
    ui->Plot->addPlottable(m_bar);

    //准备数据
    QVector<double> v_index;
    QVector<double> v_data;
    QVector<QColor> v_color;

    float mm = 10.0;
    for(int i=0;i<10;i++)
    {
        v_index<<i+1;
        v_data<<mm;
        v_color<<Qt::green;
    }

    //填充数据
    m_bar->setData(v_index,v_data,v_color);
}

Widget::~Widget()
{
    delete ui;
}
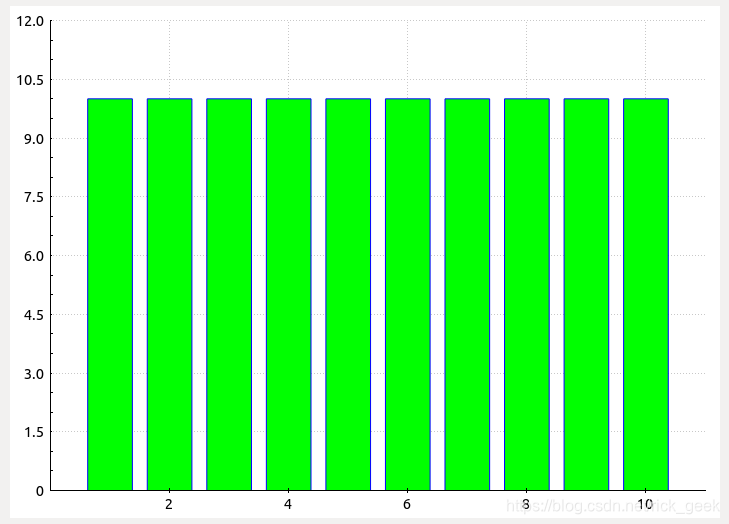
程序运行效果:


 2920
2920

 被折叠的 条评论
为什么被折叠?
被折叠的 条评论
为什么被折叠?
 到【灌水乐园】发言


