


目录
简述:
日志分析是运维工程师解决系统故障,发现问题的主要手段。日志主要包括系统日志、应用程序日志和安全日志。系统运维和开发人员可以通过日志了解服务器软硬件信息、检查配置过程中的错误及错误发生的原因,经常分析日志可以了解服务器的负荷,性能安全性,从而及时采取措施纠正错误。
日志是一个非常庞大的数据,并且常常被分散在不同的设备上,这样排查问题的时候找日志就非常繁琐困难。
这时,一个专门处理日志的系统就非常必要,这里介绍其中的一种,ELK日志分析系统(ELasticsearch+Logstash+Kibana)
————————————————
环境:
三台主机
关闭防火墙和安全规则
[root@bogon ~]# iptables -F
[root@bogon ~]# setenforce 0
[root@bogon ~]# systemctl stop firewalld
设置主机名
第一台 elk-node1
第二台 elk-node2
第三台 现在不进行操作 等下用到再说
1,2台都用系统自带java环境
主机映射配置
/etc/hosts
192.168.1.117 elk-node1
192.168.1.120 elk-node2先说一下这个服务 过程中容易端口丢失 建议调整内核和内存 不然费老大劲了
开始
上传软件包
[root@elk-node1 elk软件包]# rpm -ivh elasticsearch-5.5.0.rpm
警告:elasticsearch-5.5.0.rpm: 头V4 RSA/SHA512 Signature, 密钥 ID d88e42b4: NOKEY
准备中... ################################# [100%]
Creating elasticsearch group... OK
Creating elasticsearch user... OK
正在升级/安装...
1:elasticsearch-0:5.5.0-1 ################################# [100%]
### NOT starting on installation, please execute the following statements to configure elasticsearch service to start automatically using systemd
sudo systemctl daemon-reload
sudo systemctl enable elasticsearch.service
### You can start elasticsearch service by executing
sudo systemctl start elasticsearch.service
已经告诉我们下一步了
可能报错Java Runtime分配的内存不足,导致服务无法启动。
要解决这个问题,可以尝试增加Java Runtime的内存限制。修改Elasticsearch配置文件中的jvm.options文件,找到-Xms和-Xmx参数(代表Java Heap内存的最小值和最大值),分别调整为比当前更大的值。例如,将-Xms和-Xmx参数分别设置为2GB或4GB或者512m,取决于当前机器的可用内存。然后重新启动Elasticsearch服务,看看是否解决了问题。如果还是无法启动,可能需要考虑增加机器的物理内存或优化Elasticsearch的索引和查询等操作。
[root@elk-node1 elk软件包]# systemctl daemon-reload
[root@elk-node1 elk软件包]# sudo systemctl enable elasticsearch.service
Created symlink from /etc/systemd/system/multi-user.target.wants/elasticsearch.service to /usr/lib/systemd/system/elasticsearch.service.
修改node1和node2配置文件
vim /etc/elasticsearch/elasticsearch.yml
17 cluster.name: my-elk-cluster
23 node.name: :elk-node1
33 path.data: /data/elk_data
37 path.logs: /var/log/elasticsearch
55 network.host: 0.0.0.0
59 http.port: 9200
68 discovery.zen.ping.unicast.hosts: ["elk-node1", "elk-node2"]
90 http.cors.enabled: true 这两行只有node1添加
91 http.cors.allow-origin: "*"
创建目录并且把用户权限改为elasticsearch
[root@elk-node2 ~]# mkdir -p /data/elk_data
[root@elk-node2 ~]# chown elasticsearch:elasticsearch /data/elk_data/
启动服务并查看端口
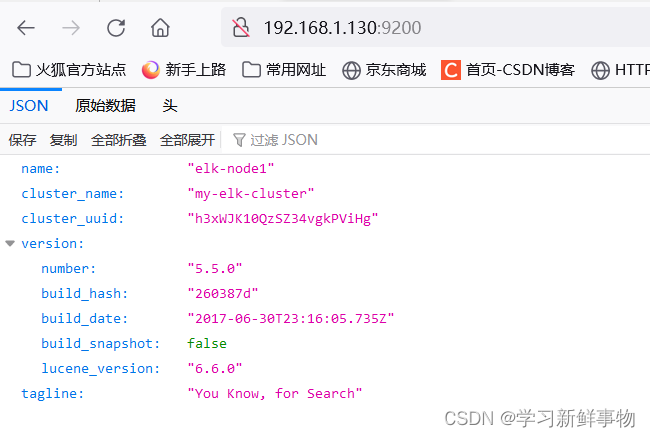
[root@elk-node1 ~]# systemctl start elasticsearch.service
[root@elk-node1 ~]# netstat -anpt | grep 9200
tcp6 0 0 :::9200 :::* LISTEN 56622/java
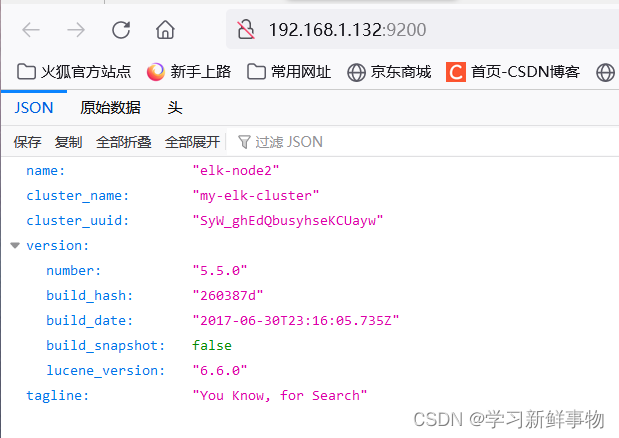
[root@elk-node2 ~]# systemctl restart elasticsearch.service
[root@elk-node2 ~]# netstat -anpt | grep 9200
tcp6 0 0 :::9200 :::* LISTEN 55553/java
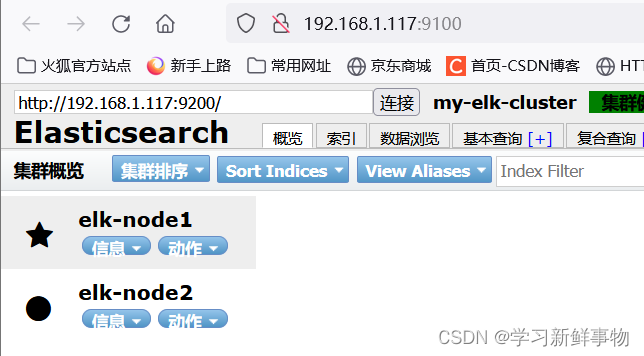
访问节点IP
第一台安装elasticsearch-head插件
解压软件包 tar xf node-v8.2.1-linux-x64.tar.gz -C /usr/local/
做链接
[root@elk-node1 elk软件包]# ln -s /usr/local/node-v8.2.1-linux-x64//bin/npm /usr/bin/node
[root@elk-node1 elk软件包]# ln -s /usr/local/node-v8.2.1-linux-x64//bin/npm /usr/local/bin
解压head包
[root@elk-node1 elk软件包]# tar xf elasticsearch-head.tar.gz -C /data/elk_data/
cd到elk_data
[root@elk-node1 elk软件包]# cd /data/elk_data/
修改用户和组
[root@elk-node1 elk_data]# chown -R elasticsearch:elasticsearch elasticsearch-head/
cd到elasticsearch-head/
[root@elk-node1 elk_data]# cd elasticsearch-head/
安装nmp
[root@elk-node1 elasticsearch-head]# npm install
npm WARN deprecated fsevents@1.2.13: The v1 package contains DANGEROUS / INSECURE binaries. Upgrade to safe fsevents v2
npm WARN optional SKIPPING OPTIONAL DEPENDENCY: fsevents@^1.0.0 (node_modules/karma/node_modules/chokidar/node_modules/fsevents):
npm WARN notsup SKIPPING OPTIONAL DEPENDENCY: Unsupported platform for fsevents@1.2.13: wanted {"os":"darwin","arch":"any"} (current: {"os":"linux","arch":"x64"})
npm WARN elasticsearch-head@0.0.0 license should be a valid SPDX license expression
up to date in 8.357s
cd到_site下把app.js做备份并编辑
[root@elk-node1 elasticsearch-head]# cd _site/
[root@elk-node1 _site]# cp app.js{,.bak}
[root@elk-node1 _site]# vim app.js
进去后按4329加大G就到4329行了
4329 行 this.base_uri = this.config.base_uri || this.prefs.get("app-base_uri") || "http://192.168.1.117:9200";
启动npm
[root@elk-node1 _site]# npm run start &
[1] 4423
[root@elk-node1 _site]#
> elasticsearch-head@0.0.0 start /data/elk_data/elasticsearch-head
> grunt server
Running "connect:server" (connect) task
Waiting forever...
Started connect web server on http://localhost:9100
systemctl start elasticsearch
启动elasticsearch
[root@elk-node1 _site]# systemctl start elasticsearch
查看端口
[root@elk-node1 _site]# netstat -lnpt | grep 9100
tcp 0 0 0.0.0.0:9100 0.0.0.0:* LISTEN 4433/grunt
访问节点IP
 cdc
cdc
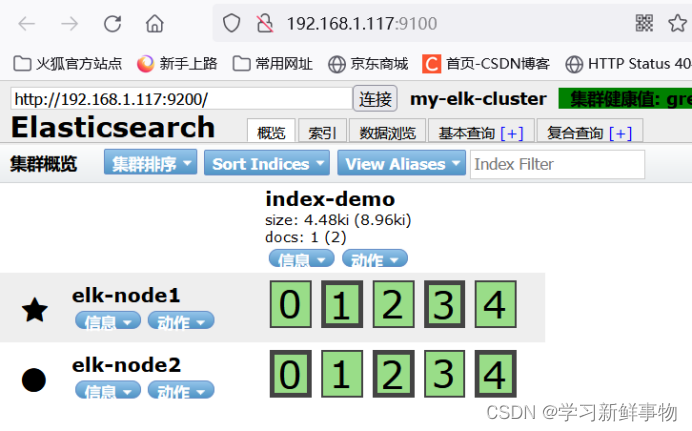
插入数据 测试类型为test
[root@elk-node1 _site]# curl -XPUT 'localhost:9200/index-demo/test/1?pretty&pretty' -H 'Content-Type: application/json' -d '{ "user": "zhangsan","mesg":"hello word" }'
这是一个使用curl命令向本地Elasticsearch实例中的index-demo索引的test类型添加文档的请求。具体来说,这个命令:
- 使用PUT方法向Elasticsearch发送请求;
- 请求的URL是'http://localhost:9200/index-demo/test/1',其中的index-demo是索引名,test是类型名,1是文档ID;
- 使用'Content-Type: application/json'头告诉Elasticsearch请求体的内容类型为JSON;
- 在请求体中,添加了一条文档数据,其中"user": "zhangsan"表示该文档的"user"字段的值为"zhangsan","mesg":"hello word"表示该文档的"mesg"字段的值为"hello world";
- 最后使用'pretty'参数和'pretty'选项让Elasticsearch返回格式化后的JSON响应,以便查看。
{
"_index" : "index-demo",
"_type" : "test",
"_id" : "1",
"_version" : 1,
"result" : "created",
"_shards" : {
"total" : 2,
"successful" : 2,
"failed" : 0
},
"created" : true
}
刷新查看变化
第一台node1安装logstash
rpm -ivh logstash-5.5.1.rpm
Logstash是一个开源的数据收集引擎,主要用于从各种不同的数据源(如服务器日志、应用程序日志、传感器数据等)中实时收集、处理和传输数据。其主要作用是:
数据收集:Logstash可以从各种数据源中收集数据,包括日志文件、数据库、消息队列等。
数据处理:Logstash提供了各种插件,可以对收集到的数据进行过滤、解析和转换,使得数据能够被更好地理解和使用。
数据传输:Logstash可以将处理后的数据输出到各种目的地,如Elasticsearch、Kafka、Amazon S3等,方便进一步的数据分析和处理。
Logstash是一个非常强大的数据收集和处理工具,可以帮助用户快速从各种数据源中收集、处理和传输数据,提高数据的实时性和可用性,为企业决策提供有力的支持。
启动服务并做链接
systemctl start logstash
ln -s /usr/share/logstash/bin/logstash /usr/local/bin/
启动一个logstash -e 标准输入
[root@elk-node1 elk软件包]# logstash -e 'input { stdin{} } output { stdout{} }'
ERROR StatusLogger No log4j2 configuration file found. Using default configuration: logging only errors to the console.
WARNING: Could not find logstash.yml which is typically located in $LS_HOME/config or /etc/logstash. You can specify the path using --path.settings. Continuing using the defaults
Could not find log4j2 configuration at path //usr/share/logstash/config/log4j2.properties. Using default config which logs to console
20:53:11.284 [main] INFO logstash.setting.writabledirectory - Creating directory {:setting=>"path.queue", :path=>"/usr/share/logstash/data/queue"}
20:53:11.294 [main] INFO logstash.setting.writabledirectory - Creating directory {:setting=>"path.dead_letter_queue", :path=>"/usr/share/logstash/data/dead_letter_queue"}
20:53:11.378 [LogStash::Runner] INFO logstash.agent - No persistent UUID file found. Generating new UUID {:uuid=>"a184b92b-62d6-416a-86bc-d496e1d07fbc", :path=>"/usr/share/logstash/data/uuid"}
20:53:11.590 [[main]-pipeline-manager] INFO logstash.pipeline - Starting pipeline {"id"=>"main", "pipeline.workers"=>2, "pipeline.batch.size"=>125, "pipeline.batch.delay"=>5, "pipeline.max_inflight"=>250}
20:53:11.681 [[main]-pipeline-manager] INFO logstash.pipeline - Pipeline main started
The stdin plugin is now waiting for input:
20:53:11.825 [Api Webserver] INFO logstash.agent - Successfully started Logstash API endpoint {:port=>9600}
www.baidu.com 输入网页 手动输入
2023-07-06T12:53:26.772Z elk-node1 www.baidu.com
www.slan.com.cn 手动输入
2023-07-06T12:53:48.435Z elk-node1 www.slan.com.cn
显示详细输出
[root@elk-node1 elk软件包]# logstash -e 'input { stdin{} } output { stdout{ codec =>rubydebug} }'
ERROR StatusLogger No log4j2 configuration file found. Using default configuration: logging only errors to the console.
WARNING: Could not find logstash.yml which is typically located in $LS_HOME/config or /etc/logstash. You can specify the path using --path.settings. Continuing using the defaults
Could not find log4j2 configuration at path //usr/share/logstash/config/log4j2.properties. Using default config which logs to console
20:54:54.115 [[main]-pipeline-manager] INFO logstash.pipeline - Starting pipeline {"id"=>"main", "pipeline.workers"=>2, "pipeline.batch.size"=>125, "pipeline.batch.delay"=>5, "pipeline.max_inflight"=>250}
20:54:54.241 [[main]-pipeline-manager] INFO logstash.pipeline - Pipeline main started
The stdin plugin is now waiting for input:
20:54:54.387 [Api Webserver] INFO logstash.agent - Successfully started Logstash API endpoint {:port=>9600}
www.baidu.com 手动输入
{
"@timestamp" => 2023-07-06T12:55:04.406Z,
"@version" => "1",
"host" => "elk-node1",
"message" => "www.baidu.com"
}
配置收集系统日志 第一台
[root@elk-node1 conf.d]# vim systemc.conf
input {
file {
path => "/var/log/messages"
type => "system"
start_position => "beginning"}
}
output {
elasticsearch {
hosts => ["192.168.1.117:9200"]
index => "system-%{+YYYY.MM.dd}"
}
}重启logstash
[root@elk-node1 _site]# systemctl restart logstash
加载文件查看是否打入到es
[root@elk-node1 conf.d]# logstash -f systemc.conf
安装kibana第一台
[root@elk-node1 elk软件包]# rpm -ivh kibana-5.5.1-x86_64.rpm
警告:kibana-5.5.1-x86_64.rpm: 头V4 RSA/SHA512 Signature, 密钥 ID d88e42b4: NOKEY
准备中... ################################# [100%]
正在升级/安装...
1:kibana-5.5.1-1 ################################# [100%]设置开机自启
[root@elk-node1 elk软件包]# systemctl enable kibana.service
Created symlink from /etc/systemd/system/multi-user.target.wants/kibana.service to /etc/systemd/system/kibana.service.修改配置文件并启动
[root@elk-node1 elk软件包]# vim /etc/kibana/kibana.yml2 server.port: 5601
7 server.host: "0.0.0.0"
21 elasticsearch.url: "http://192.168.1.117:9200"
30 kibana.index: ".kibana"
[root@localhost elk软件包]# systemctl restart kibana.service查看端口
[root@elk-node1 elk软件包]# netstat -lnpt | grep 5601
tcp 0 0 0.0.0.0:5601 0.0.0.0:* LISTEN 4370/noderoot@elk-node1 elk软件包]# logstash -f /etc/logstash/conf.d/system.conf
访问
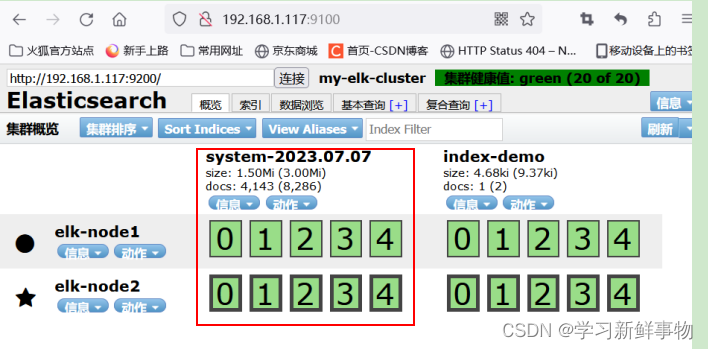
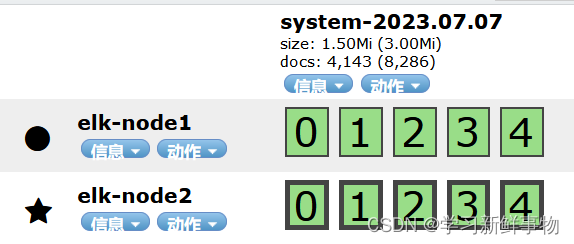
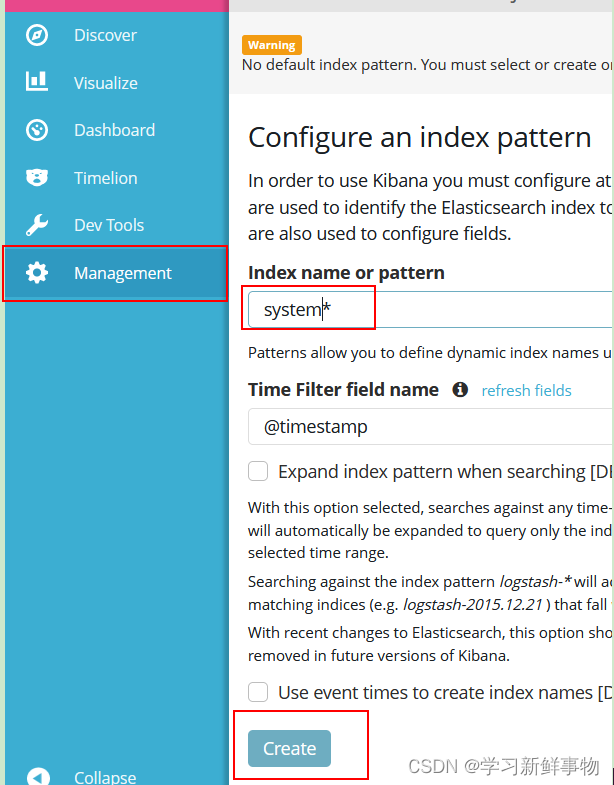
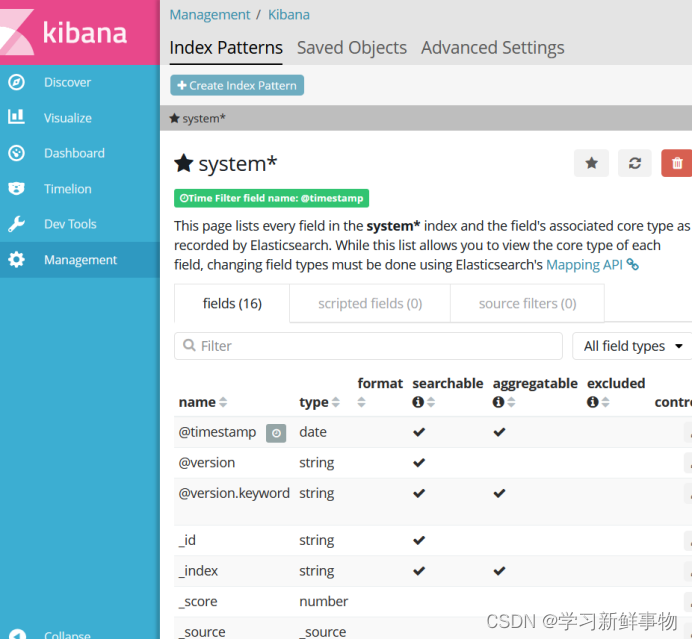
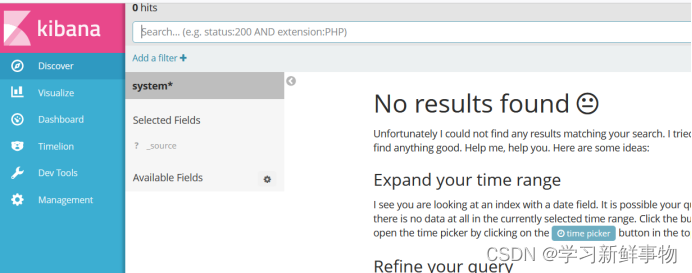
创建 注意 system-2023.07.07
访问 192.168.1.117:5601
把英文添加进去
看一下有没有创建成功
第三台
起名
[root@localhost ~]# hostname apache
刷新
[root@localhost ~]# bash
关闭防火墙和安全规则
[root@apache ~]# iptables -F
[root@apache ~]# systemctl stop firewalld
[root@apache ~]# setenforce 0
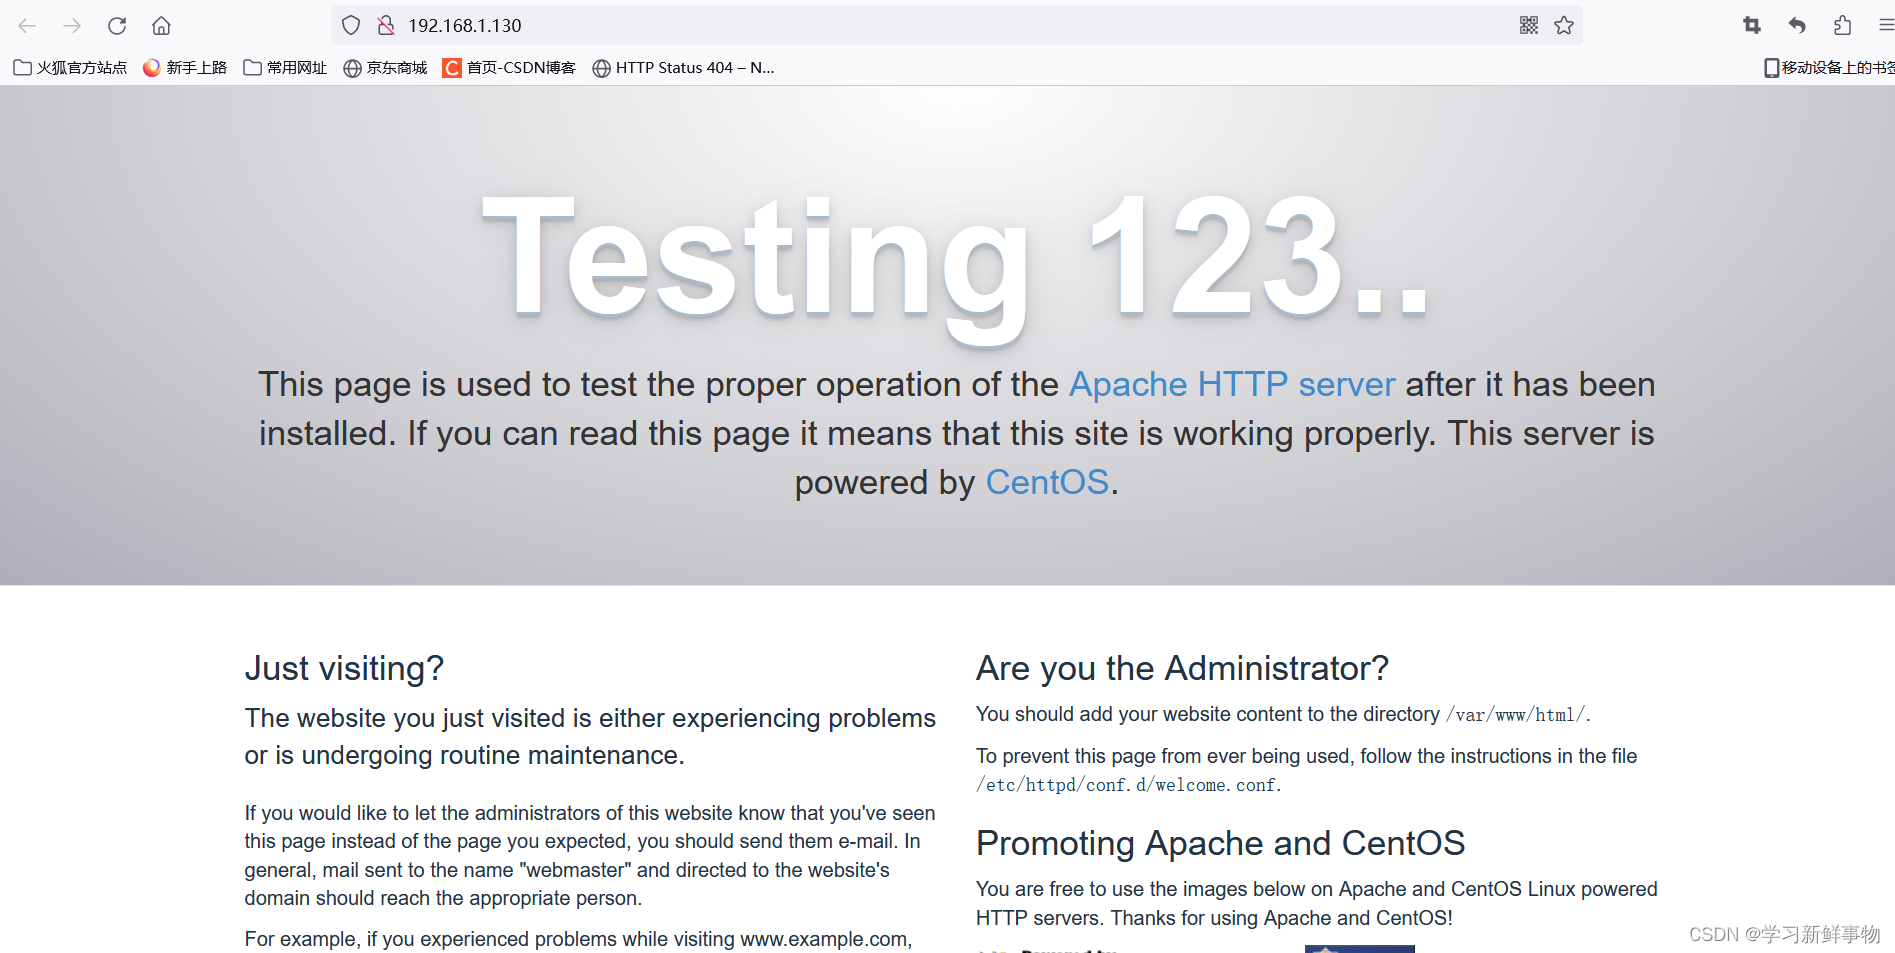
安装httpd
root@apache ~]# yum -y install httpd
启动
[root@apache ~]# systemctl start httpd
注意java环境上传软件包
[root@apache ~]# rpm -ivh logstash-5.5.1.rpm
警告:logstash-5.5.1.rpm: 头V4 RSA/SHA512 Signature, 密钥 ID d88e42b4: NOKEY
准备中... ################################# [100%]
正在升级/安装...
1:logstash-1:5.5.1-1 ################################# [100%]
Using provided startup.options file: /etc/logstash/startup.options
OpenJDK 64-Bit Server VM warning: If the number of processors is expected to increase from one, then you should configure the number of parallel GC threads appropriately using -XX:ParallelGCThreads=N
Successfully created system startup script for Logstash
设置开机启动
[root@apache ~]# systemctl enable logstash.service
Created symlink from /etc/systemd/system/multi-user.target.wants/logstash.service to /etc/systemd/system/logstash.service.
cd到logstash下
[root@apache ~]# cd /etc/logstash/conf.d/
编辑配置文件
[root@apache conf.d]# vim apache_log.conf
nput {
file {
path => "/var/log/httpd/access_log"
type => "access"
start_position => "beginning"
}
file {
path => "/var/log/httpd/error_log"
type => "error"
start_position => "beginning"
}
}
output {
if [type] == "access" {
elasticsearch {
hosts => ["192.168.1.117:9200"]
index => "apache_access-%{+YYYY.MM.dd}"
}
}
if [type] == "error" {
elasticsearch {
hosts => ["192.168.1.117:9200"]
index => "apache_error-%{+YYYY.MM.dd}"
}
}
}
创建链接文件
[root@apache bin]# ln -s /usr/share/logstash/bin/logstash /usr/local/bin/
[root@apache bin]# ll
总用量 0
lrwxrwxrwx. 1 root root 32 7月 7 11:36 logstash -> /usr/share/logstash/bin/logstash
[root@apache bin]# cd /etc/logstash/conf.d/
加载文件
[root@apache conf.d]# logstash -f apache_log.conf
OpenJDK 64-Bit Server VM warning: If the number of processors is expected to increase from one, then you should configure the number of parallel GC threads appropriately using -XX:ParallelGCThreads=N
ERROR StatusLogger No log4j2 configuration file found. Using default configuration: logging only errors to the console.
WARNING: Could not find logstash.yml which is typically located in $LS_HOME/config or /etc/logstash. You can specify the path using --path.settings. Continuing using the defaults
Could not find log4j2 configuration at path //usr/share/logstash/config/log4j2.properties. Using default config which logs to console
11:37:25.689 [main] INFO logstash.setting.writabledirectory - Creating directory {:setting=>"path.queue", :path=>"/usr/share/logstash/data/queue"}
11:37:25.693 [main] INFO logstash.setting.writabledirectory - Creating directory {:setting=>"path.dead_letter_queue", :path=>"/usr/share/logstash/data/dead_letter_queue"}
11:37:25.909 [LogStash::Runner] INFO logstash.agent - No persistent UUID file found. Generating new UUID {:uuid=>"e79973b7-8439-4aaf-9f4a-248acb91eb3f", :path=>"/usr/share/logstash/data/uuid"}
11:37:26.125 [LogStash::Runner] ERROR logstash.agent - Cannot create pipeline {:reason=>"Expected one of #, input, filter, output at line 1, column 1 (byte 1) after "}
:class=>"LogStash::Outputs::ElasticSearch", :hosts=>[#<Java::JavaNet::URI:0x54a65874>]}
12:04:31.849 [[main]-pipeline-manager] INFO logstash.pipeline - Starting pipeline {"id"=>"main", "pipeline.workers"=>1, "pipeline.batch.size"=>125, "pipeline.batch.delay"=>5, "pipeline.max_inflight"=>125}
12:04:32.199 [[main]-pipeline-manager] INFO logstash.pipeline - Pipeline main started
12:04:32.380 [Api Webserver] INFO logstash.agent - Successfully started Logstash API endpoint {:port=>9601} 显示这个证明成功
随便输入一些东西
bvnc vch df hdf dfh hfdaefssdfgsfdg
去网页登陆一下httpd
网页查看192.168.1.117:9100
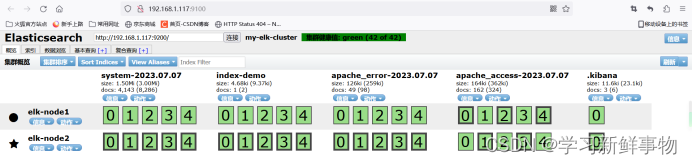
创建
看看有没有创建成功
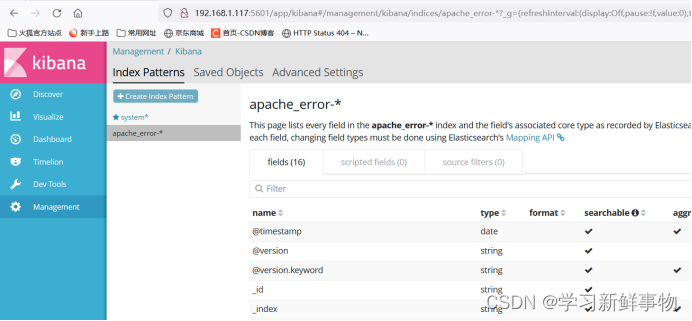
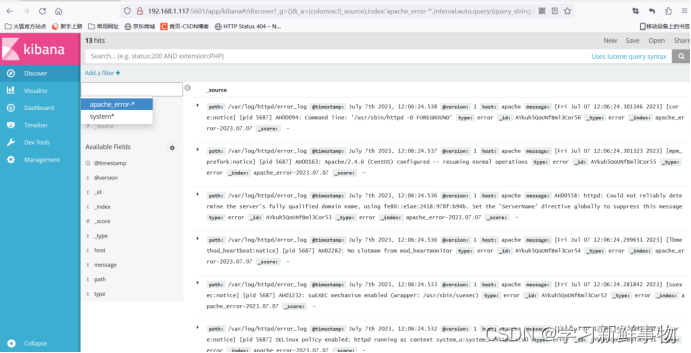
进入
查看
拜拜


 16万+
16万+

 被折叠的 条评论
为什么被折叠?
被折叠的 条评论
为什么被折叠?
 到【灌水乐园】发言


