


 本文介绍了OpenLayers的核心概念,包括Map、Layer、Source、Feature及其关系。通过示例展示了如何初始化地图,设置图层以及将成都设为中心。此外,还详细讲解了如何创建点Feature、处理GeoJSON数据以及定义自定义样式,如五角星形状。同时,讨论了图层交互,如移动功能,并涵盖了坐标转换方法。
Openlayers
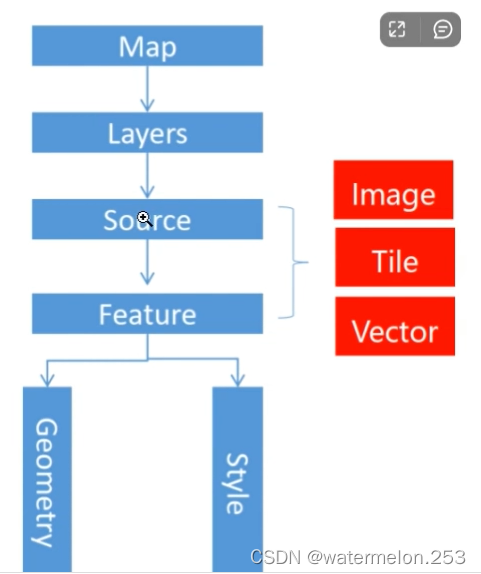
一、核心
Map==>Layer==>Source==>Feature==>Geometry/Style
//初始化一个简单的地图,所有类要提前引入
const initMap = () => {
    state.map = new Map({
        target: 'map',
        layers: [
            new TileLayer({
                source: new XYZ({
                    url: "https://wprd0{1-4}.is.autonavi.com/appmaptile?lang=zh_cn&size=1&style=7&x={x}&y={y}&z={z}",
                })
            }),
        ],
        view: new View({
            center: olProj.fromLonLat([104.06, 30.67]),// 将成都作为地图中心
            // extent: [100, 25, 110, 35],// 设置地图的中心范围:[最小经度,最小纬度,最大经度,最大纬度]
            // projection: 'EPSG:4326',// 指定投影使用EPSG:4326
            zoom: 10,
            // 添加缩放范围
            // minZoom: 9,
            // maxZoom: 14
        }),
        controls: defaults().extend([
            new FullScreen(),//全屏
            // new MousePosition(),//显示鼠标当前位置的经纬度
            new ScaleLine(),//比例尺
            new OverviewMap(),//鸟瞰图控件
            // new ZoomSlider(),//缩放滚动条控件
            // new ZoomToExtent(),//放大到设定区域控件
            // new Attribution(),// 右下角的地图信息控件
            // new Zoom(),//缩放按钮
            // new Rotate(),//指北针
        ]),
        // interactions不设置的情况下,默认会设置为ol.interaction.defaults(),即所有交互都有,归纳为缩放,平移,旋转三类;支持键盘,鼠标,和触屏
        // 但是用键盘控制地图平移和缩放,是不行的。 原因在于地图使用的target获取不到键盘事件;需给地图div设置tabindex,才能使div获得键盘事件
    })
}
二、创建一个点Feature
// 创建矢量图层
const setVectors = () => {
    let arr = [[104.06, 30.67], [104.56, 30.67], [104.06, 31.17], [104.06, 30.17], [103.56, 30.67]]
    // 批量创建features(几何信息+样式信息)
    let features = arr.map(val => {
        return new Feature({
            geometry: new Point(olProj.fromLonLat([...val]))
        })
    })
    let style = new Style({
        image: new sCircle({
            radius: 10,
            //点要素填充
            fill: new Fill({
                color: 'red'
            }),
            //点要素的描边
            stroke: new Stroke({
                color: 'red',
            })
        })
    })
    // 批量设置style
    features.forEach(val => {
        val.setStyle(style)
    })
    // 将features添加到source
    let source = new VectorSource({
        features: features
    })
    // 创建图层
    let pointLayer = new VectorLayer({
        source,
    })
    state.map.addLayer(pointLayer)
}
geojson数据构建Feature要素
geojson数据是矢量数据,是包含地理信息的json数据,格式以key:value的形式存在
#创建geojson数据
let data={
    type:'FeatureCollection',
    feature:[
        type:'Feature',
        geometry:{
            type:'Point',
            coordinates:[114..30,30.50]
        }
    ]
}
#将数据添加到矢量数据源中
let source = new ol.source Vector({
    features:new ol.format.GeoJSON().readFeatures(data)
})
#设置矢量图层
let layer=new ol.layer.Vector({
    source
})
#设置样式
const style=new ol.style.Style({
     image: new sCircle({
            //点要素的半径
            radius: 10,
            //点要素填充
            fill: new Fill({
                color: 'red'
            }),
            //点要素的描边
            stroke: new Stroke({
                color: 'red',
            })
        })
})
#添加样式到矢量图层中
layer.setStyle(style)
#添加矢量图层到地图
map.addLayer(layer)
-
new ol.format.GeoJSON().readFeatures(data)读取geojson数据构建features -
type取值:
-
Point点要素
-
LineString线要素
-
线要素的 coordinates
 feature:[
        type:'Feature',
        geometry:{
            type:'LineString',
            coordinates: [ [114..30,30.50] , [114..32,30.52] ]
        }
    ]
-
-
Polygon多边形要素
 feature:[
        type:'Feature',
        geometry:{
            type:'Polygon',
            coordinates: [
     		[ [114..30,30.50] , [114..32,30.52], ... 多个点 ]
 	     ]
        }
    ]
-
创建一个五角星要素
let star = new Feature({
      geometry: new Point(olProj.fromLonLat([104.06, 30.67]))//图形的位置
})
star.setStyle( new Style({
      image: new RegularShape({
            points: 5,//顶点数
            radius1: 20,//外圈大小
            radius2: 10,//内圈大小
            stroke: new Stroke({//描边样式
                color: "blue",
                size: 1
            }),
            fill: new Fill({//填充样式
                color: 'blue'
            })
      })
}))
图层交互
// 添加移动交互
    let translate = new Translate({
        layers: [layer]
    })
    state.map.addInteraction(translate)
    // 可以监听一下拖动开始和结束的事件,拖动后的经纬度可以从e里面获取
    translate.on('translateend', (e) => {
        state.showPopup=true
        let coordinate = olProj.transform(e.coordinate, 'EPSG:3857', 'EPSG:4326')
        state.curPosition = olCoordinate.toStringHDMS(coordinate)
        // 弹窗设置
        let overlay = new Overlay({
            element: document.getElementById('popup'),
            positioning: 'bottom-center',// 根据position属性的位置来进行相对点位
            offset: [0, -30],// 在positioning之上再进行偏移
            autoPan: true
        })
        state.map.addOverlay(overlay)
        overlay.setPosition(e.coordinate)//设置弹窗的位置在拖动结束的位置
        // console.log("结束位置的经纬度",coordinate)
    })
    // 拖动开始事件translatestart,拖动结束事件translateend
坐标转化
(一) 坐标系互相转化:ol.proj.transform([经,纬],'EPSG:4326', 'EPSG:3857')
参数1:需转化的坐标
参数2:当前坐标系
参数3:需要转成的坐标系
补充:'EPSG:4326’经纬度坐标;'EPSG:3857’墨卡托坐标系
(二) 将坐标转化为标准经纬度格式:ol.coordinate.toStringHDMS(EPSG:4326格式的经纬度坐标)
transform([经,纬],‘EPSG:4326’, ‘EPSG:3857’)`
参数1:需转化的坐标
参数2:当前坐标系
参数3:需要转成的坐标系
补充:'EPSG:4326’经纬度坐标;'EPSG:3857’墨卡托坐标系
(二) 将坐标转化为标准经纬度格式:ol.coordinate.toStringHDMS(EPSG:4326格式的经纬度坐标)
(三) 投影到到目标投影的坐标 fromLonLat([经,纬]),经纬度格式为EPSG:4326


 1621
1621

 被折叠的 条评论
为什么被折叠?
被折叠的 条评论
为什么被折叠?
 到【灌水乐园】发言


