


以下图表适配1090*1080大屏
柱状图
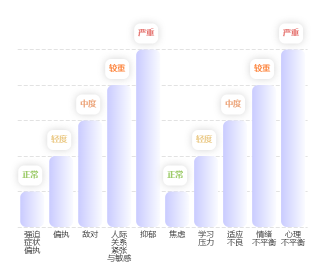
X轴渐变柱状图
/// 通过 selected legend
          legend: {
            align: 'left',
            left: '82%',
            top: '0%',
            textStyle: {
              color: '#fff' // 图例文字颜色
            },
            data: ['总计', '热点', '热源', '视频告警', '其他'],
            selected: {
              '总计': true,
              '热点': false,
              '热源': false,
              '视频告警': false,
              '其他': false
            }
          },
{
      backgroundColor: 'rgba(0,0,0,0)',
      grid: {
        top: '15%',
        right: '3%',
        left: '5%',
        bottom: '14%'
      },
      xAxis: [{
        type: 'category',
        color: '#59588D',
        data: ['强迫\n症状', '偏执', '敌对', '人际\n关系\n紧张\n与敏感', '抑郁', '焦虑', '学习\n压力', '适应\n不良', '情绪\n不平衡', '心理\n不平衡'],
        axisLine: { show: false},
        splitLine: { show: false },
        axisTick: { show: false },
        axisLabel: {
          interval: 0,
          margin: 4,
          color: '#343434',
          textStyle: {
            fontWeight: 400,
            fontSize: 8
          },
        },
      }],
      yAxis: [{
        type: 'value',
        min: 0,
        max: 5,
        axisLabel: {show: false},
        axisLine: {show: false},
        splitLine: {
          lineStyle: {
            color: '#E2E2E2',
            type: 'dashed' // 设置为虚线
          }
        }
      }],
      series: [
        {
          type: 'bar',
          data: [1, 2, 3, 4, 5, 1, 2, 3,4,5],
          barWidth: '24px',
          itemStyle: {
            normal: {
              color: new echarts.graphic.LinearGradient(0, 0, 1, 0, [{
                offset: 0,
                color: '#C9CBFF' // 0% 处的颜色
              }, {
                offset: 1,
                color: '#FAFBFF' // 100% 处的颜色
              }], false),
              barBorderRadius: [6, 6, 6, 6],
              shadowColor: 'rgba(0,255,225,0)',
            }
          },
          label: {
            show: true,
            lineHeight: 20,
            width: 24,
            height: 20,
            backgroundColor: '#fff',
            borderRadius: 6,
            shadowColor: '#D4D4D4',
            shadowBlur:8,
            // shadowOffsetX: 10,
            // shadowOffsetY: 10,
            position: ['10', '-26'],
            // distance: 1,
            align: 'center',
            formatter: (params: any)=> {
              const value = params.value;
              let str = ''
              if(value >= 1 && value <= 1.99 ) {
                str = '{a|正常}'
              } else if (value >= 2 && value <= 2.99) {
                str = '{b|轻度}'
              } else if (value >= 3 && value <= 3.99) {
                str = '{c|中度}'
              } else if (value >= 4 && value <= 4.99) {
                str = '{d|较重}'
              } else {
                str = '{e|严重}'
              }
              return str
            },
            rich: {
              a: {
                fontSize: 8,
                fontWeight: 600,
                color: '#9ACA65',
              },
              b: {
                fontSize: 8,
                fontWeight: 600,
                color: '#EBCA87',
              },
              c: {
                fontSize: 8,
                fontWeight: 600,
                color: '#ECA378',
              },
              d: {
                fontSize: 8,
                fontWeight: 600,
                color: '#FD833B',
              },
              e: {
                fontSize: 8,
                fontWeight: 600,
                color: '#E46D69',
              }
            }
            // normal: {
            // }
          }
        },
      ]
    }
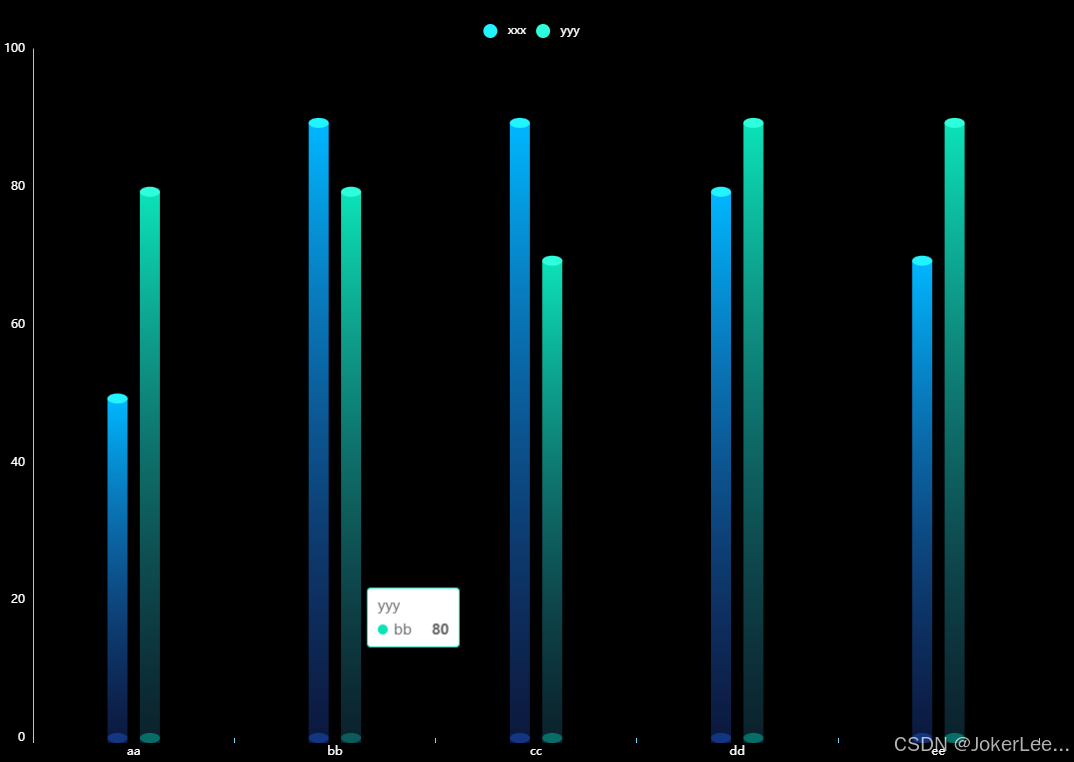
双圆柱图
// (https://flowercloud.net/aff.php?aff=11050)
    const xAxisData = ['aa','bb', 'cc','dd', 'ee'];
    const data1 = [50,90,90,80,70];
    const data2 = [80,80,70,90,90];
    const barWidth = 20;

    const color1 = {
      x: 0,
      y: 0,
      x2: 0,
      y2: 1,
      type: 'linear',
      global: false,
      colorStops: [
        {
          //第一节下面
          offset: 0,
          color: '#00B7FF',
        },
        {
          offset: 1,
          color: 'rgba(34,68,172,0.35)',
        },
      ],
    };
    const color2 = {
      x: 0,
      y: 0,
      x2: 0,
      y2: 1,
      type: 'linear',
      global: false,
      colorStops: [
        {
          //第一节下面
          offset: 0,
          color: '#0BE2B8',
        },
        {
          offset: 1,
          color: 'rgba(31,93,122,0.35)',
        },
      ],
    };
    option = {
      backgroundColor: 'rgba(0,0,0,1)',
      tooltip: {
        trigger: 'item',
      },
      legend: {
        top: 10,
        textStyle: {
          color: '#fff',
          fontSize: 12,
          fontWeight: 400
        },
      },
      grid: {
        top: 40,
        left: 10,
        right: 30,
        bottom: 0,
        containLabel: true
      },
      xAxis: {
        type: 'category',
        axisLabel: {
          color: '#fff',//字体颜色
          fontSize: 12,
        },
        axisLine: { // 轴线的颜色以及宽度
          show: false,
          lineStyle: {
            color: "#7FD6FF",
            width: 1,
          },
        },
        boundaryGap: true, // 不从原点开始
        data: xAxisData
      },
      yAxis: {
        type: 'value',
        // name: '单位: 数量',
        // nameTextStyle: {
        //   color: '#fff',//字体颜色
        //   fontSize: 14,
        //   fontWeight: 400,
        //   padding: [0, 50, 0, 0] // 文字往左移动
        // },
        axisLine: { // 轴线的颜色以及宽度
          show: true,
          lineStyle: {
            color: "#7FD6FF",
            width: 1,
          },
        },
        axisLabel: {
          color: '#fff',//字体颜色
          fontSize: 12,
        },
        boundaryGap: ['0%', '20%'], // 留白策略
        splitLine:{ // 设置刻度线的样式
          show: false,
          lineStyle:{
            color: "#68B4DD",
            width: 1,
            type:'dashed'
          }
        },
        min: 0,
        max: 100
      },
      series: [
        // 顶部圆形图案
        {
          name: 'xxx',
          type: 'pictorialBar',
          symbolSize: [barWidth, 10],
          symbolOffset: ['-81%', 0],
          symbolPosition: 'end',
          z: 15,
          color: '#21F3FF',
          zlevel: 4,
          animationDelay: 400,
          data: data1
        },
        {
          name: 'yyy',
          type: 'pictorialBar',
          symbolSize: [barWidth, 10],
          symbolOffset: ['81%', 0],
          symbolPosition: 'end',
          z: 15,
          color: '#2DFFDC',
          zlevel: 4,
          animationDelay: 400,
          data: data2
        },
        // 中间圆柱体
        {
          name: 'xxx',
          type: 'pictorialBar',
          symbolSize: [barWidth, '100%'],
          symbolOffset: ['-81%', 5],
          z: 15,
          symbol: 'rect',
          color: color1,
          zlevel: 3,
          data: data1
        },
        {
          name: 'yyy',
          type: 'pictorialBar',
          symbolSize: [barWidth, '100%'],
          symbolOffset: ['81%', 5],
          z: 15,
          symbol: 'rect',
          color: color2,
          zlevel: 2,
          data: data2
        },
        // 底部圆柱体
        {
          name: 'xxx',
          type: 'pictorialBar',
          symbolSize: [barWidth, 10],
          symbolOffset: ['-81%', 5],
          z: 15,
          color: 'rgba(31,97,234,0.4)',
          zlevel: 3,
          data: data1
        },
        {
          name: 'yyy',
          type: 'pictorialBar',
          symbolSize: [barWidth, 10],
          symbolOffset: ['81%', 5],
          z: 15,
          color: 'rgba(0,226,192,0.4)',
          zlevel: 2,
          data: data2
        },
      ]
    };
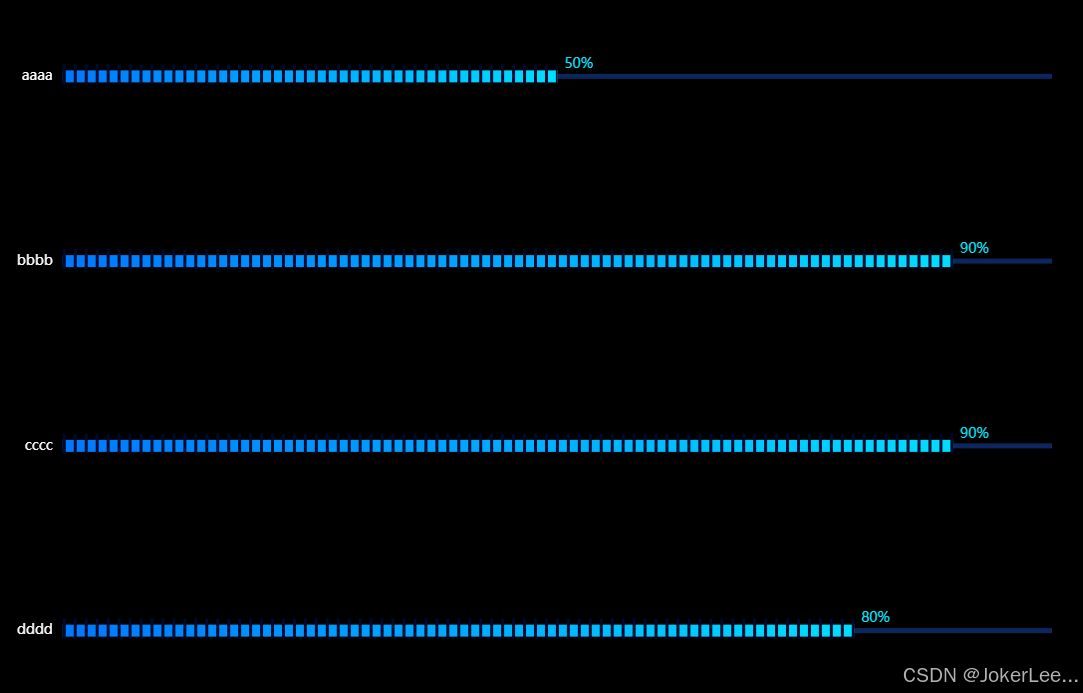
横着刻度柱状图
  // (https://flowercloud.net/aff.php?aff=11050)
    const xAxisData = ['aaaa','bbbb', 'cccc','dddd'];
    const data1 = [50,90,90,80];
    const symbolData = data1.map(()=> 100);
    const barWidth = 12;
    const max = 100;
    option = {
      backgroundColor: 'rgba(0,0,0,1)',
      tooltip: {
        trigger: 'item',
      },
      grid: {
        top: 10,
        left: 10,
        right: 30,
        bottom: 0,
        containLabel: true
      },
      xAxis: {
        type: 'value',
        max: max,
        splitLine: {
          show: false
        },
        axisLine: {
          show: false
        },
        axisLabel: {
          show: false
        },
        axisTick: {
          show: false
        }
      },
      yAxis: {
        type: "category",
        inverse: true,
        data: xAxisData,
        axisLine: {
          show: false
        },
        axisTick: {
          show: false
        },
        axisLabel: {
          margin: 10,
          textStyle: {
            color: "#fff",
            fontSize: 14
          }
        }
      },
      series: [
        { //内
          type: 'bar',
          barWidth: barWidth,
          legendHoverLink: false,
          // silent: true,
          itemStyle: {
            color: {
              type: 'linear',
              x: 0,
              y: 0,
              x2: 1,
              y2: 0,
              colorStops: [{
                offset: 0,
                color: '#0078FF' // 0% 处的颜色
              }, {
                offset: 1,
                color: '#00DEFF' // 100% 处的颜色
              }],
              globalCoord: false // 缺省为 false
            } //底色
          },
          label: {
            show: true, //开启显示
            offset: [2, -12],
            position: 'right', //在上方显示
            formatter: '{c}%',//显示百分号
            textStyle: { //数值样式
              color: '#00E3FB',//字体颜色
              fontSize: 14//字体大小
            }
          },
          zlevel: 2,
          data: data1
        },
        {
          type: 'pictorialBar',
          symbol: 'rect',
          symbolSize: ['100%', 5],
          z: 15,
          color: 'rgba(31,97,234,0.4)',
          zlevel: 1,
          data: symbolData,
        },
        { //分隔
          type: "pictorialBar",
          itemStyle: {
            color: "#000A2A"
          },
          symbolRepeat: "fixed",
          symbolMargin: 4,
          symbol: 'rect',
          symbolClip: true,
          symbolSize: [3, 20],
          symbolPosition: "start",
          symbolOffset: [0, -2],
          zlevel: 3,
          symbolBoundingData: max,
          data: data1
        }
      ]
    };
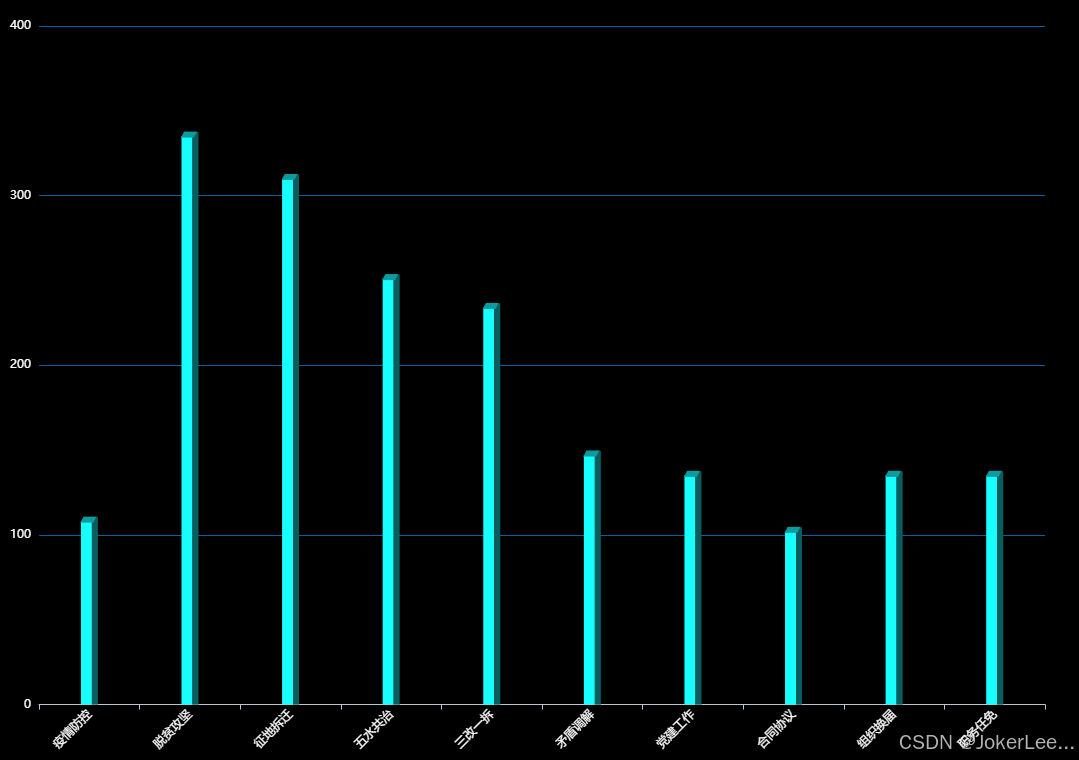
3d柱状图
// (https://flowercloud.net/aff.php?aff=11050)
    const data =  [
      { value: 108, name: '疫情防控' },
      { value: 335, name: '脱贫攻坚' },
      { value: 310, name: '征地拆迁' },
      { value: 251, name: '五水共治' },
      { value: 234, name: '三改一拆' },
      { value: 147, name: '矛盾调解' },
      { value: 135, name: '党建工作' },
      { value: 102, name: '合同协议' },
      { value: 135, name: '组织换届' },
      { value: 135, name: '职务任免' },
    ]
    const sideData = data.map(item => item.value + 2.5)
    const nameArray = data.map(e =>e.name);
    const barWidth = 11;

    option = {
      backgroundColor: 'rgba(0,0,0,1)',
      tooltip: {
        trigger: 'item',
      },
      // legend: {
      //   top: 10,
      //   textStyle: {
      //     color: '#fff',
      //     fontSize: 12,
      //     fontWeight: 400
      //   },
      // },
      grid: {
        top: 20,
        left: 10,
        right: 30,
        bottom: 0,
        containLabel: true
      },
      xAxis: {
        type: 'category',
        axisLabel: {
          color: '#fff',//字体颜色
          fontSize: 12,
          rotate:45,
        },
        axisLine: { // 轴线的颜色以及宽度
          show: true,
          lineStyle: {
            color: "#BAC6D0",
            width: 1,
          },
        },
        boundaryGap: true, // 不从原点开始
        data: nameArray
      },
      yAxis: {
        type: 'value',
        // name: '单位: 数量',
        // nameTextStyle: {
        //   color: '#fff',//字体颜色
        //   fontSize: 14,
        //   fontWeight: 400,
        //   padding: [0, 50, 0, 0] // 文字往左移动
        // },
        axisLine: { // 轴线的颜色以及宽度
          show: false,
          lineStyle: {
            color: "#7FD6FF",
            width: 1,
          },
        },
        axisLabel: {
          color: '#fff',//字体颜色
          fontSize: 12,
        },
        boundaryGap: ['0%', '20%'], // 留白策略
        splitLine:{ // 设置刻度线的样式
          show: true,
          lineStyle:{
            color: "#0860A5",
            width: 1,
            type:'solid'
          }
        },
      },
  series: [{
    // 正面
        name: 'a',
        tooltip: {
            show: false
        },
        type: 'bar',
        barWidth: barWidth,
        itemStyle: {
            normal: {
                color: new echarts.graphic.LinearGradient(0, 1, 0, 0, [{
                    offset: 0,
                    color: "#18FDFE" // 0% 处的颜色
                }, {
                    offset: 1,
                    color: "#18FDFE" // 100% 处的颜色
                }], false)
            }
        },
        data: data,
        barGap: 0
    }, {
      // 侧面
        type: 'bar',
        barWidth: 6,
        itemStyle: {
            normal: {
                color: new echarts.graphic.LinearGradient(0, 1, 0, 0, [{
                    offset: 0,
                    color: "#085D5E" // 0% 处的颜色
                }, {
                    offset: 1,
                    color: "#085D5E" // 100% 处的颜色
                }], false)
            }
        },
        barGap: 0,
        data: sideData
    }, {
        name: 'a',
        tooltip: {
            show: false
        },
        type: 'pictorialBar',
        itemStyle: {
            borderWidth: 1,
            borderColor: '#0571D5',
            color: '#0D9C9D'
        },
        symbol: 'path://M 0,0 l 120,0 l -30,60 l -120,0 z',
        symbolSize: ['16', '6'],
        symbolOffset: ['-1', '-5'],
        symbolPosition: 'end',
        data: data,
        z: 3
    }]
    };
3d柱状图菱形

// (https://flowercloud.net/aff.php?aff=11050)
    const data =  [
      { value: 108, name: '单位1' },
      { value: 335, name: '单位2' },
      { value: 310, name: '单位3' },
      { value: 251, name: '单位4' },
      { value: 234, name: '单位5' },
      { value: 147, name: '单位6' },
      { value: 135, name: '单位7' },
      { value: 102, name: '单位8' }
    ]
    const nameArray = data.map(e =>e.name);
    const barWidth = 20;

    const colors = {
      type: 'linear',
      x: 0,
      x2: 1,
      y: 0,
      y2: 0,
      colorStops: [
        {
          offset: 0,
          color: '#06738A' // 最左边
        }, {
          offset: 0.5,
          color: 'rgba(6,115,138,0.7)' // 左边的右边 颜色
        }, {
          offset: 0.5,
          color: 'rgba(43,189,231,0.7)' // 右边的左边 颜色
        }, {
          offset: 1,
          color: 'rgba(43,189,231,0.7)'
        }]
    }
    option = {
      backgroundColor: 'rgba(0,0,0,1)',
      title: {
        text: '标题',
        textStyle: {
          fontSize: 14,
          fontWeight: 400
        },
        left: 'center',
        top: 10
      },
      tooltip: {
        trigger: 'item',
      },
      // legend: {
      //   top: 10,
      //   textStyle: {
      //     color: '#fff',
      //     fontSize: 12,
      //     fontWeight: 400
      //   },
      // },
      grid: {
        top: 40,
        left: 10,
        right: 30,
        bottom: 0,
        containLabel: true
      },
      xAxis: {
        type: 'category',
        axisLabel: {
          color: '#fff',//字体颜色
          fontSize: 12,
        },
        axisLine: { // 轴线的颜色以及宽度
          show: true,
          lineStyle: {
            color: "#BAC6D0",
            width: 1,
          },
        },
        boundaryGap: true, // 不从原点开始
        data: nameArray
      },
      yAxis: {
        type: 'value',
        // name: '单位: 数量',
        // nameTextStyle: {
        //   color: '#fff',//字体颜色
        //   fontSize: 14,
        //   fontWeight: 400,
        //   padding: [0, 50, 0, 0] // 文字往左移动
        // },
        axisLine: { // 轴线的颜色以及宽度
          show: false,
          lineStyle: {
            color: "#7FD6FF",
            width: 1,
          },
        },
        axisLabel: {
          color: '#fff',//字体颜色
          fontSize: 12,
        },
        boundaryGap: ['0%', '20%'], // 留白策略
        splitLine:{ // 设置刻度线的样式
          show: true,
          lineStyle:{
            color: "#B2C2D3",
            width: 1,
            type:'dashed'
          }
        },
      },
      series: [
        // 顶部矩形
        {
          z: 3,
          type: 'pictorialBar',
          symbolPosition: 'end',
          data: data,
          symbol: 'diamond',
          symbolOffset: [0, '-50%'],
          symbolSize: [barWidth, barWidth * 0.5],
          itemStyle: {
            normal: {
              borderWidth: 0,
              color: 'rgba(43,189,231,0.9)',
            }
          },
        },
        {
          type: 'bar',
          barWidth: barWidth,
          itemStyle: {
            normal: {
              color: colors
            }
          },
          label: {
            show: false,
            position: [barWidth / 2, -(barWidth + 20)],
            color: '#ffffff',
            fontSize: 14,
            fontStyle: 'bold',
            align: 'center',
          },
          data: data
        },
        // 底部矩形
        {
          z: 2,
          type: 'pictorialBar',
          data: data,
          symbol: 'diamond',
          symbolOffset: [0, '50%'],
          symbolSize: [barWidth, barWidth * 0.5],
          itemStyle: {
            normal: {
              color: colors
            }
          },
        },
      ]
    };


 594
594

 被折叠的 条评论
为什么被折叠?
被折叠的 条评论
为什么被折叠?
 到【灌水乐园】发言


