


发现最近成长很多,之前测距测面于我来说,做起来遥不可及,现在不到半天的工作时间便做出了淹没分析,当然也是参考的了
前提地图要设置了地形~
1、vue 前端代码
<div class="sub_ana_container" v-show="showFlowTool">
      <div class="saclose" @click="closeFlowTool">x</div>
      <label>最大高度:</label>
      <input type="number" v-model="height_max">
      <label>最小高度:</label>
      <input type="number" v-model="height_min">
      <label>淹没速度:</label>
      <input type="number" v-model="speed">
      <button class="btn" v-on:click="startFlowing()">开始</button>
      <button class="btn" v-on:click="clearFlowing()">清除</button>
      <button class="btn" v-on:click="draw_ymfw()">绘制淹没范围</button>
    </div>
2、css样式
.sub_ana_container {
  position: absolute;
  right: 20%;
  top: 1%;
  width: auto;
  height: auto;
  border: solid 1px;
  padding: 12px;
  color: rgb(221, 218, 218);
  background-color: rgba(6, 89, 161, 0.8);
}
.saclose{
  position: absolute;
  right: 5px;
  top: 3px;
  cursor: pointer;
}
.btn {
  color: white;
  background-color: #555758;
  border: #555758;
  margin: 6px;
}
input {
  width: 100px;
}
label {
  margin: 8px;
  color: rgb(221, 218, 218);
}
input[type="radio"] {
  width: 30px;
}
3、methods方法使用
// 淹没分析------------------------
    closeFlowTool() {
      this.showFlowTool = false
    },
    drawFlowingPolygon() {
      const flowing_draw = new SubmergenceAnalysis()
    },
    draw_polygon() {
      const _this = this
      var handler = new Cesium.ScreenSpaceEventHandler(viewer.scene.canvas)
      // 取消双击事件-追踪该位置
      viewer.cesiumWidget.screenSpaceEventHandler.removeInputAction(
        Cesium.ScreenSpaceEventType.LEFT_DOUBLE_CLICK
      )
      // 鼠标事件
      handler = new Cesium.ScreenSpaceEventHandler(
        viewer.scene._imageryLayerCollection
      )
      var positions = []
      var tempPoints = []
      var polygon = null
      var cartesian = null
      var floatingPoint

      handler.setInputAction(function (movement) {
        const ray = viewer.camera.getPickRay(movement.endPosition)
        cartesian = viewer.scene.globe.pick(ray, viewer.scene)
        // cartesian = viewer.scene.camera.pickEllipsoid(movement.endPosition, viewer.scene.globe.ellipsoid);
        if (positions.length >= 2) {
          if (!Cesium.defined(polygon)) {
            polygon = new PolygonPrimitive(positions)
          } else {
            positions.pop()
            positions.push(cartesian)
          }
        }
      }, Cesium.ScreenSpaceEventType.MOUSE_MOVE)

      handler.setInputAction(function (movement) {
        const ray = viewer.camera.getPickRay(movement.position)
        cartesian = viewer.scene.globe.pick(ray, viewer.scene)
        // cartesian = viewer.scene.camera.pickEllipsoid(movement.position, viewer.scene.globe.ellipsoid);
        if (positions.length == 0) {
          positions.push(cartesian.clone())
        }
        // positions.pop();
        positions.push(cartesian)
        // 在三维场景中添加点
        var cartographic = Cesium.Cartographic.fromCartesian(
          positions[positions.length - 1]
        )
        var longitudeString = Cesium.Math.toDegrees(cartographic.longitude)
        var latitudeString = Cesium.Math.toDegrees(cartographic.latitude)
        var heightString = cartographic.height
        tempPoints.push({
          lon: longitudeString,
          lat: latitudeString,
          hei: heightString
        })
        _this.tempPoints.push(longitudeString)
        _this.tempPoints.push(latitudeString)
        // floatingPoint = viewer.entities.add({
        //   name: '多边形面积',
        //   position: positions[positions.length - 1],
        //   point: {
        //     pixelSize: 5,
        //     color: Cesium.Color.WHITE,
        //     outlineColor: Cesium.Color.DEEPSKYBLUE,
        //     outlineWidth: 3
        //   }
        // })
        // measureFeature_polygon.push(floatingPoint)
      }, Cesium.ScreenSpaceEventType.LEFT_CLICK)

      handler.setInputAction(function (movement) {
        handler.destroy()
        positions.pop()
        // var polyCenter = Cesium.BoundingSphere.fromPoints(positions).center
        // var textArea = getArea(tempPoints) + 'km²'
        // const _label = viewer.entities.add({
        //   name: '多边形面积',
        //   position: polyCenter,
        //   // position: positions[positions.length - 1],
        //   label: {
        //     text: textArea,
        //     font: '16px sans-serif',
        //     fillColor: Cesium.Color.DARKORANGE,
        //     heightReference: Cesium.HeightReference.CLAMP_TO_GROUND
        //   }
        // })
        // measureFeature_polygon.push(_label)
      }, Cesium.ScreenSpaceEventType.RIGHT_CLICK)

      var radiansPerDegree = Math.PI / 180.0 // 角度转化为弧度(rad)
      var degreesPerRadian = 180.0 / Math.PI // 弧度转化为角度

      // 计算多边形面积
      function getArea(points) {
        var res = 0
        // 拆分三角曲面
        for (var i = 0; i < points.length - 2; i++) {
          var j = (i + 1) % points.length
          var k = (i + 2) % points.length
          var totalAngle = Angle(points[i], points[j], points[k])

          var dis_temp1 = distance(positions[i], positions[j])
          var dis_temp2 = distance(positions[j], positions[k])
          res += dis_temp1 * dis_temp2 * Math.abs(Math.sin(totalAngle))
          console.log(res)
        }

        return (res / 1000000.0).toFixed(4)
      }
      function logPosition (position) {
        var ray = viewer.camera.getPickRay(position)
        var cartesian = viewer.scene.globe.pick(ray, viewer.scene)
        var cartographic = Cesium.Ellipsoid.WGS84.cartesianToCartographic(cartesian)
        var long2 = Cesium.Math.toDegrees(cartographic.longitude)
        var lat2 = Cesium.Math.toDegrees(cartographic.latitude)
        console.log(long2 + ',' + lat2)
      }

      /* 角度 */
      function Angle(p1, p2, p3) {
        var bearing21 = Bearing(p2, p1)
        var bearing23 = Bearing(p2, p3)
        var angle = bearing21 - bearing23
        if (angle < 0) {
          angle += 360
        }
        return angle
      }
      /* 方向 */
      function Bearing(from, to) {
        var lat1 = from.lat * radiansPerDegree
        var lon1 = from.lon * radiansPerDegree
        var lat2 = to.lat * radiansPerDegree
        var lon2 = to.lon * radiansPerDegree
        var angle = -Math.atan2(
          Math.sin(lon1 - lon2) * Math.cos(lat2),
          Math.cos(lat1) * Math.sin(lat2) -
            Math.sin(lat1) * Math.cos(lat2) * Math.cos(lon1 - lon2)
        )
        if (angle < 0) {
          angle += Math.PI * 2.0
        }
        angle = angle * degreesPerRadian // 角度
        return angle
      }

      var PolygonPrimitive = (function () {
        function _(positions) {
          this.options = {
            name: '多边形',
            polygon: {
              hierarchy: [],
              // perPositionHeight : true,
              material: new Cesium.Color(0, 124 / 255, 247 / 255, 0.2)
              // material: Cesium.Color.GREEN.withAlpha(0.5)
              // heightReference:20000
            }
          }

          this.hierarchy = { positions }
          this._init()
        }

        _.prototype._init = function () {
          var _self = this
          var _update = function () {
            return _self.hierarchy
          }
          // 实时更新polygon.hierarchy
          this.options.polygon.hierarchy = new Cesium.CallbackProperty(
            _update,
            false
          )
          const _polygon = viewer.entities.add(this.options)
          measureFeature_polygon.push(_polygon)
        }

        return _
      })()

      function distance(point1, point2) {
        var point1cartographic = Cesium.Cartographic.fromCartesian(point1)
        var point2cartographic = Cesium.Cartographic.fromCartesian(point2)
        /** 根据经纬度计算出距离**/
        var geodesic = new Cesium.EllipsoidGeodesic()
        geodesic.setEndPoints(point1cartographic, point2cartographic)
        var s = geodesic.surfaceDistance
        // console.log(Math.sqrt(Math.pow(distance, 2) + Math.pow(endheight, 2)));
        // 返回两点之间的距离
        s = Math.sqrt(
          Math.pow(s, 2) +
            Math.pow(point2cartographic.height - point1cartographic.height, 2)
        )
        return s
      }
    },
    draw_ymfw() {
      this.draw_polygon()
    },
    startFlowing() {
      if (!this.obj) {
        this.obj = new SubmergenceAnalysis(
          viewer,
          true,
          this.height_max,
          this.height_min,
          this.speed,
          true,
          this.tempPoints
        )
      }
      this.obj.tempPoints = this.tempPoints
      this.obj.start()
    },
    clearFlowing() {
      this.obj && this.obj.clear()
      this.clearMeasureFeature()
      this.tempPoints = []
      this.obj = null
    }
4、淹没分析的js文件 submerg-analysis.js
引入js
import SubmergenceAnalysis from '../../public/static/cesium/submerg-analysis'submerg-analysis.js
// 淹没分析
export default class SubmergenceAnalysis {
    constructor(viewer, isTerrain = true, height_max, height_min, speed, map_type, tempPoints) {
        debugger
        this.viewer = viewer
        this.isTerrain = isTerrain
        this.handler = null
        this.tempEntities = []
        this.polygonEntities = []
        this.linePositionList = []

        this.pointArr = []
        this.lineEntities = []

        this.tempPoints = []
        this.extrudedHeight = height_min
        this.height_max = height_max
        this.height_min = height_min
        this.speed = speed
        // 默认是范围图/深度图
        this.map_type = map_type
        this.polygon_degrees = tempPoints
        // this.polygon_degrees = [
        //     117.8396128404095, 24.758688509239484,
        //     118.0106511230382, 24.797143096351466,
        //     117.8429783463796, 24.651905270780798,
        //     118.03641195329993, 24.68701116597361
        //     // 115.8784, 40.0198,
        //     // 115.9473, 40.0381,
        //     // 115.9614, 40.0073,
        //     // 115.9042, 39.9912
        // ]
        this._initViewStatus(this.viewer)
        this._addDisListener()
    }

    _initViewStatus(viewer) {
        var scene = viewer.scene
        scene.globe.depthTestAgainstTerrain = true
        // scene.camera.setView({
        //     // 摄像头的位置
        //     destination: Cesium.Cartesian3.fromDegrees(117.80189427650359, 24.700148777225785, 1500.0),
        //     // destination: Cesium.Cartesian3.fromDegrees(115.9216, 39.9870, 1500.0),
        //     orientation: {
        //         heading: Cesium.Math.toRadians(0.0), // 默认朝北0度,顺时针方向,东是90度
        //         pitch: Cesium.Math.toRadians(-20), // 默认朝下看-90,0为水平看,
        //         roll: Cesium.Math.toRadians(0)// 默认0
        //     }
        // })
        viewer.skyAtmosphere = false
    }

    // 根据矩形范围得到行列数点坐标和高程信息
    _getPoints(xmin, xmax, ymin, ymax) {
        const x_count = 10
        const y_count = 10
        const cartesians = new Array(x_count * y_count)
        const x_d = (xmax - xmin) / x_count
        for (var i = 0; i < x_count; ++i) {
            const start_pt = { x: xmin + i * x_d, y: ymax }
            const end_pt = { x: xmin + i * x_d, y: ymin }
            for (let j = 0; j < y_count; j++) {
                const offset = j / (y_count - 1)
                const x = Cesium.Math.lerp(start_pt.x, end_pt.x, offset)
                const y = Cesium.Math.lerp(start_pt.y, end_pt.y, offset)
                cartesians[j + i * y_count] = Cesium.Cartographic.fromDegrees(x, y)
            }
        }
        return cartesians

    }

    _getHeights(cartesians, extrudedHeight, callback) {
        debugger
        var terrainProvider = new Cesium.CesiumTerrainProvider({
            url: 'http://localhost:8080/o_lab'
        })
        // 根据地形计算某经纬度点的高度
        var promise = Cesium.sampleTerrainMostDetailed(terrainProvider, cartesians)
        Cesium.when(promise, function (updatedPositions) {

            let positions = updatedPositions.filter(d => {
                const cartographic = d
                if (cartographic) {
                    const h_d = extrudedHeight - cartographic.height
                    return h_d > 0
                }
            })
            positions = positions.map(d => {
                const cartographic = d
                const h = extrudedHeight - cartographic.height
                return {
                    x: Cesium.Math.toDegrees(cartographic.longitude),
                    y: Cesium.Math.toDegrees(cartographic.latitude),
                    value: h
                }

            })

            if (callback) {

                callback(positions)
            }
        })
    }

    _addDisListener() {
        const viewer = this.viewer
        const scene = viewer.scene
        const linePositionList = this.linePositionList
        viewer.cesiumWidget.screenSpaceEventHandler.removeInputAction(Cesium.ScreenSpaceEventType.LEFT_DOUBLE_CLICK)
        this.handler = new Cesium.ScreenSpaceEventHandler(scene.canvas)
        // 绘制线
        this._drawLine(linePositionList)
        // this.loadGrandCanyon()
        // 绘制面
        if (this.map_type) {
            this._drawPoly(this.polygon_degrees)
        } else {
            // 得到插值网格
            const bounds = {
                west: 115.8784,
                east: 115.9614,
                south: 39.9912,
                north: 40.0381
            }

            const positions_cartesian = this._getPoints(bounds.east, bounds.west, bounds.south, bounds.north)
            this._getHeights(positions_cartesian, this.extrudedHeight, (d) => {
                // this.heatMapObj = new HeatMap(this.viewer, d, bounds)
            })
        }

    }

    _reDraw() {
        this.tempPoints = []
        this.linePositionList.length = 0
        this.areaPositionList.length = 0
        for (const entity of this.tempEntities) {
            this.viewer.entities.remove(entity)
        }
        this.tempEntities = []
    }

    _drawLine(linePositionList) {
        const lineStyle = {
            width: 2,
            material: Cesium.Color.CHARTREUSE
        }

        const entity = this.viewer.entities.add({
            polyline: lineStyle
        })

        entity.polyline.positions = new Cesium.CallbackProperty(function () {
            return linePositionList
        }, false)

        this.polygonEntities.push(entity)
    }

    _drawPoint(point_Cartesian3) {
        const entity =
            this.viewer.entities.add({
                position: point_Cartesian3,
                point: {
                    pixelSize: 10,
                    color: Cesium.Color.GOLD
                    // disableDepthTestDistance: Number.POSITIVE_INFINITY,
                    // heightReference: Cesium.HeightReference.CLAMP_TO_GROUND
                }
            })
        this.tempEntities.push(entity)
    }


    _drawPoly(degrees) {
        const that = this
        const entity =
            this.viewer.entities.add({
                polygon: {
                    hierarchy: {},
                    material: new Cesium.Color.fromBytes(64, 157, 253, 100),
                    perPositionHeight: true

                }
            })
        entity.polygon.hierarchy = new Cesium.PolygonHierarchy(Cesium.Cartesian3.fromDegreesArray(degrees))
        entity.polygon.extrudedHeight = new Cesium.CallbackProperty(() => that.extrudedHeight, false)
        this.polygonEntities.push(entity)
    }

    // 世界坐标转经纬坐标
    _car3ToLatLon(cartesian) {
        const cartographic = Cesium.Cartographic.fromCartesian(cartesian)
        const longitudeString = Cesium.Math.toDegrees(cartographic.longitude)
        const latitudeString = Cesium.Math.toDegrees(cartographic.latitude)
        return {
            lon: longitudeString,
            lat: latitudeString,
            height: cartographic.height
        }
    }


    // 移除整个资源
    remove() {
        const viewer = this.viewer
        for (const tempEntity of this.tempEntities) {
            viewer.entities.remove(tempEntity)
        }
        for (const lineEntity of this.polygonEntities) {
            viewer.entities.remove(lineEntity)
        }
        this.handler.destroy()
    }

    start() {
        const that = this
        this.timer = window.setInterval(() => {
            if ((that.height_max > that.extrudedHeight) && (that.extrudedHeight >= that.height_min)) {
                that.extrudedHeight = that.extrudedHeight + that.speed
            } else {
                that.extrudedHeight = that.height_min
            }
            if (!that.map_type) {
                if (this.heatMapObj) {
                    const bounds = {
                        west: 115.8784,
                        east: 115.9614,
                        south: 39.9912,
                        north: 40.0381
                    }
                    const positions_cartesian = this._getPoints(bounds.east, bounds.west, bounds.south, bounds.north)
                    this._getHeights(positions_cartesian, this.extrudedHeight, (d) => {
                        this.heatMapObj.update(d)
                    })
                }
            }

        }, 500)
        if (that.map_type) {
            that._drawPoly(that.polygon_degrees)
        } else {
            if (this.heatMapObj) { }

        }

    }

    clear() {
        const viewer = this.viewer
        if (this.timer) {
            window.clearInterval(this.timer)
            this.timer = null
        }
        this.extrudedHeight = this.height_min
        if (this.heatMapObj) { this.heatMapObj.show(false) }
        for (const entity of this.polygonEntities) {
            viewer.entities.remove(entity)
        }
        viewer.skyAtmosphere = true
    }

    changeMapType(type) {
        if (!type) {
            if (!this.heatMapObj) {
                // 得到插值网格
                const bounds = {
                    west: 115.8784,
                    east: 115.9614,
                    south: 39.9912,
                    north: 40.0381
                }
                const positions_cartesian = this._getPoints(bounds.east, bounds.west, bounds.south, bounds.north)
                this._getHeights(positions_cartesian, this.extrudedHeight, (d) => {
                    // this.heatMapObj = new HeatMap(this.viewer, d, bounds)
                })
            }

            this.heatMapObj && this.heatMapObj.show(true)
            for (const entity of this.polygonEntities) {
                entity.show = false
            }
        } else {
            this.heatMapObj.show(false)
            for (const entity of this.polygonEntities) {
                entity.show = true
            }
        }
    }

    // 切割一部分地形
    loadGrandCanyon() {
        var globe = this.viewer.scene.globe
        const viewer = this.viewer
        // viewer.skyAtmosphere = false,
        // Pick a position at the Grand Canyon
        var position = Cesium.Cartographic.toCartesian(new Cesium.Cartographic.fromDegrees(115.9165534, 40.0139345, 100))
        var distance = 3000.0
        var boundingSphere = new Cesium.BoundingSphere(position, distance)

        globe.clippingPlanes = new Cesium.ClippingPlaneCollection({
            modelMatrix: Cesium.Transforms.eastNorthUpToFixedFrame(position),
            planes: [
                new Cesium.ClippingPlane(new Cesium.Cartesian3(1.0, 0.0, 0.0), distance),
                new Cesium.ClippingPlane(new Cesium.Cartesian3(-1.0, 0.0, 0.0), distance),
                new Cesium.ClippingPlane(new Cesium.Cartesian3(0.0, 1.0, 0.0), distance),
                new Cesium.ClippingPlane(new Cesium.Cartesian3(0.0, -1.0, 0.0), distance)
            ],

            unionClippingRegions: true
        })
        globe.clippingPlanes.enabled = true
        viewer.camera.viewBoundingSphere(boundingSphere, new Cesium.HeadingPitchRange(0.5, -0.5, boundingSphere.radius * 5.0))
        viewer.camera.lookAtTransform(Cesium.Matrix4.IDENTITY)
    }

}
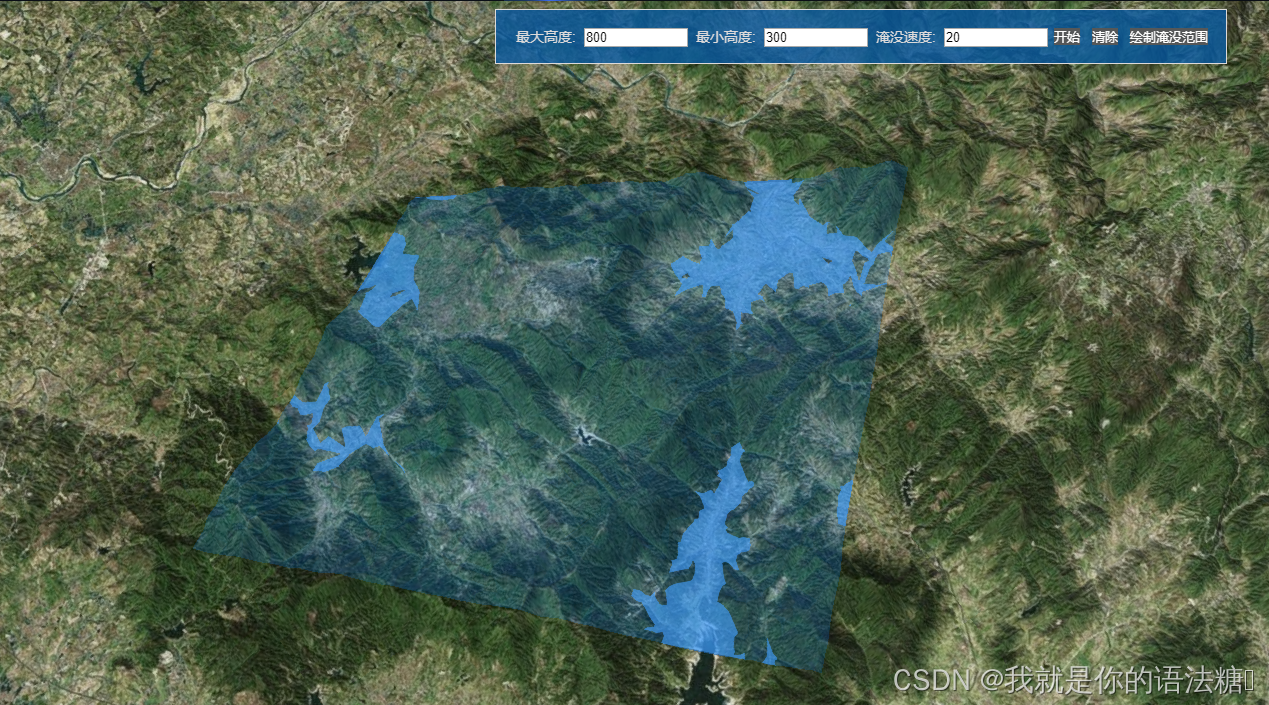
5、结果
点击绘制淹没范围,在地图上绘制需要进行分析的范围
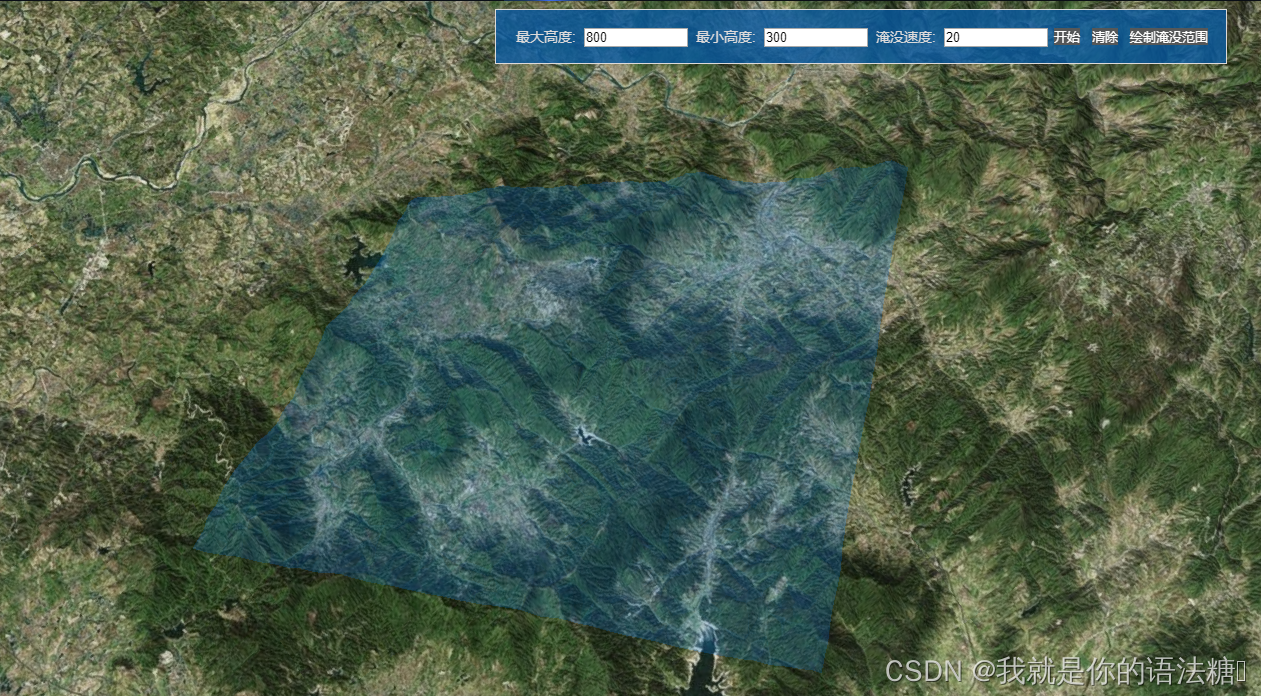
点击开始,即进行淹没分析


 2292
2292

 被折叠的 条评论
为什么被折叠?
被折叠的 条评论
为什么被折叠?
 到【灌水乐园】发言


