


 该博客介绍了一种方法,通过Echarts库实现在页面加载时默认显示特定时间点的Tooltip,并在鼠标移开图表时仍保持显示。代码示例展示了如何初始化Echarts实例,设置图表选项,以及利用dispatchAction方法控制Tooltip的显示。此外,还监听了'globalout'事件以在鼠标离开图表区域时维持Tooltip的状态。
最终显示效果如下
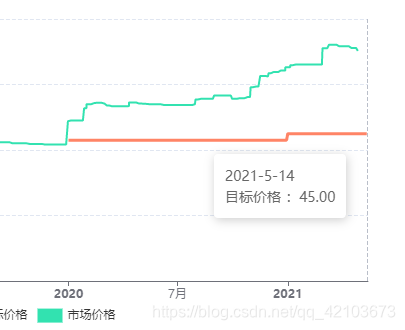
默认打开页面显示设置的某个时间点的tooltip,鼠标移开之后依然显示
下面是实现代码:一看就懂,搬走就用
 draw(tabIndex) {
      let pricetrend = this.$echarts.getInstanceByDom(document.getElementById('pricetrend' + tabIndex));
      if (pricetrend == null) {
        pricetrend = this.$echarts.init(document.getElementById('pricetrend' + tabIndex), '', { locale: "ZH" })
      }
      // 根据this.option的数据绘制图表
      pricetrend.setOption(this.option1, true)
      let tagTime1 = this.searchPOsition(this.option1.series)//查找要设置的点的tooltip在数据第几个series的第几个位置
      setTimeout(function () {
        pricetrend.dispatchAction({
          type: 'showTip',
          seriesIndex: tagTime1[0],  // 显示第几个series
          dataIndex: tagTime1[1]//第几个位置
        });
      })
      // 移出当前整个图表
      pricetrend.on('globalout', function (params) {
        // 显示 tooltip
        pricetrend.dispatchAction({
          type: 'showTip',
          seriesIndex: tagTime1[0],
          dataIndex: tagTime1[1]
        })
      })


 717
717

 被折叠的 条评论
为什么被折叠?
被折叠的 条评论
为什么被折叠?
 到【灌水乐园】发言


