


 文章介绍了如何在React应用中使用ECharts库创建动态图表,包括初始化图表、响应窗口调整大小以及使用pictorialBar类型的柱状图展示数据。
HTML
   <div class="charts">
            <div :id="id" style="width: 100%; height: 100%"></div>
   </div>
JS
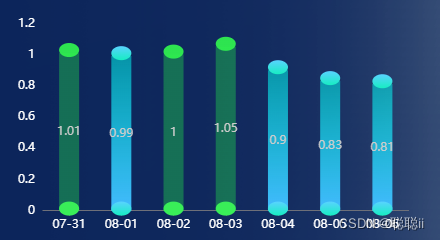
const allData = reactive({ id: guid(), //信息统计 chart: null, problems: "", totalLong: "", highWater: [101.41,99.3], siteName:['2023-07-31','2023-07-30'], }); onMounted(() => { init(); window.addEventListener("resize", resizeTheChart); }); const resizeTheChart = () => { if (allData.chart) { allData.chart.resize(); } }; const init = () => { var xData = allData.siteName; var line = allData.highWater; var attr = { name: "月平均单价", unit: "元/单", }; let chartDom = echarts.init(document.getElementById(allData.id)); var option = { tooltip: { // 鼠标悬浮提示框显示 X和Y 轴数据 trigger: "item", backgroundColor: "rgba(32, 33, 36,.7)", borderColor: "rgba(32, 33, 36,0.20)", borderWidth: 1, textStyle: { // 文字提示样式 color: "#fff", fontSize: "12", }, axisPointer: { // 坐标轴虚线 type: "cross", label: { backgroundColor: "#6a7985", }, }, }, grid: { left: "10%", top: "10%", right: "5%", bottom: "10%", }, xAxis: [ { data: allData.siteName, type: "category", axisTick: { alignWithLabel: true, }, axisLabel: { show: true, textStyle: { color: "#ffffff", }, }, }, ], yAxis: [ { splitLine: { show: false, lineStyle: { color: "#eee", type: "solid", }, }, axisTick: { show: false, }, axisLine: { show: false, }, axisLabel: { textStyle: { color: "#ffffff", }, }, }, ], dataZoom: [ { type: "inside", }, ], series: [ { //柱底圆片 name: "", type: "pictorialBar", symbolSize: [20, 14], symbolOffset: [0, 5], z: 12, itemStyle: { normal: { color: function (params) { var index_color = params.value; if (index_color < 1) { return new echarts.graphic.LinearGradient( 0, 0, 0, 1, [ { offset: 0, color: "rgba(89,211,255,1)", }, { offset: 1, color: "rgba(23,237,194,1)", }, ] ); } else { return new echarts.graphic.LinearGradient( 0, 0, 0, 1, [ { offset: 0, color: "rgba(57, 238, 88)", }, { offset: 1, color: "rgba(57, 238, 88)", }, ] ); } }, }, }, data: line, }, //柱体 { name: "", label: { show: true, position: "inside", // normal: { // formatter: function (params) { // if (params.value > 1) { // return "{ng|" + params.value + "}"; // } else { // return "{b|" + params.value + "}"; // } // }, // rich: { // ng: { // color: "red", // }, // b: { // color: "#35ff0a", // }, // }, // }, }, type: "bar", barWidth: 20, barGap: "0%", itemStyle: { normal: { color: function (params) { var index_color = params.value; if (index_color < 1) { return new echarts.graphic.LinearGradient( 0, 0, 0, 1, [ { offset: 0, color: "rgba(0,255,245,0.5)", }, { offset: 1, color: "#43bafe", }, ] ); } else { return new echarts.graphic.LinearGradient( 0, 0, 0, 1, [ { offset: 0, color: "rgba(30, 182, 79,0.5)", }, { offset: 1, color: "rgba(30, 182, 79,0.5)", }, ] ); } }, }, }, data: line, }, //柱顶圆片 { name: "", type: "pictorialBar", symbolSize: [20, 14], symbolOffset: [0, -10], z: 12, symbolPosition: "end", itemStyle: { normal: { color: function (params) { var index_color = params.value; if (index_color < 1) { return new echarts.graphic.LinearGradient( 0, 0, 0, 1, [ { offset: 0, color: "rgba(89,211,255,1)", }, { offset: 1, color: "rgba(23,237,194,1)", }, ] ); } else { return new echarts.graphic.LinearGradient( 0, 0, 0, 1, [ { offset: 0, color: "rgba(47, 238, 79,0.95)", }, { offset: 1, color: "rgba(47, 238, 79,0.95)", }, ] ); } }, }, }, data: line, }, ], }; option && chartDom.setOption(option, true); allData.chart = chartDom; // chartDom.on("click", (params) => { // bus.emit("showPipline", params.data); // }); };


 2808
2808

 被折叠的 条评论
为什么被折叠?
被折叠的 条评论
为什么被折叠?
 到【灌水乐园】发言


