


 该博客围绕React项目展开,介绍了项目文件目录结构、App根组件内的路由策略写法,包括BrowerserRouter、Switch、Route、Link与NavLink等标签的使用。还给出全局css代码、Package.json配置文件详情,最后展示了Bar、Home、Line、multiple等组件的代码。
项目效果图如下:
首先我们来看一下简单的项目文件目录结构:
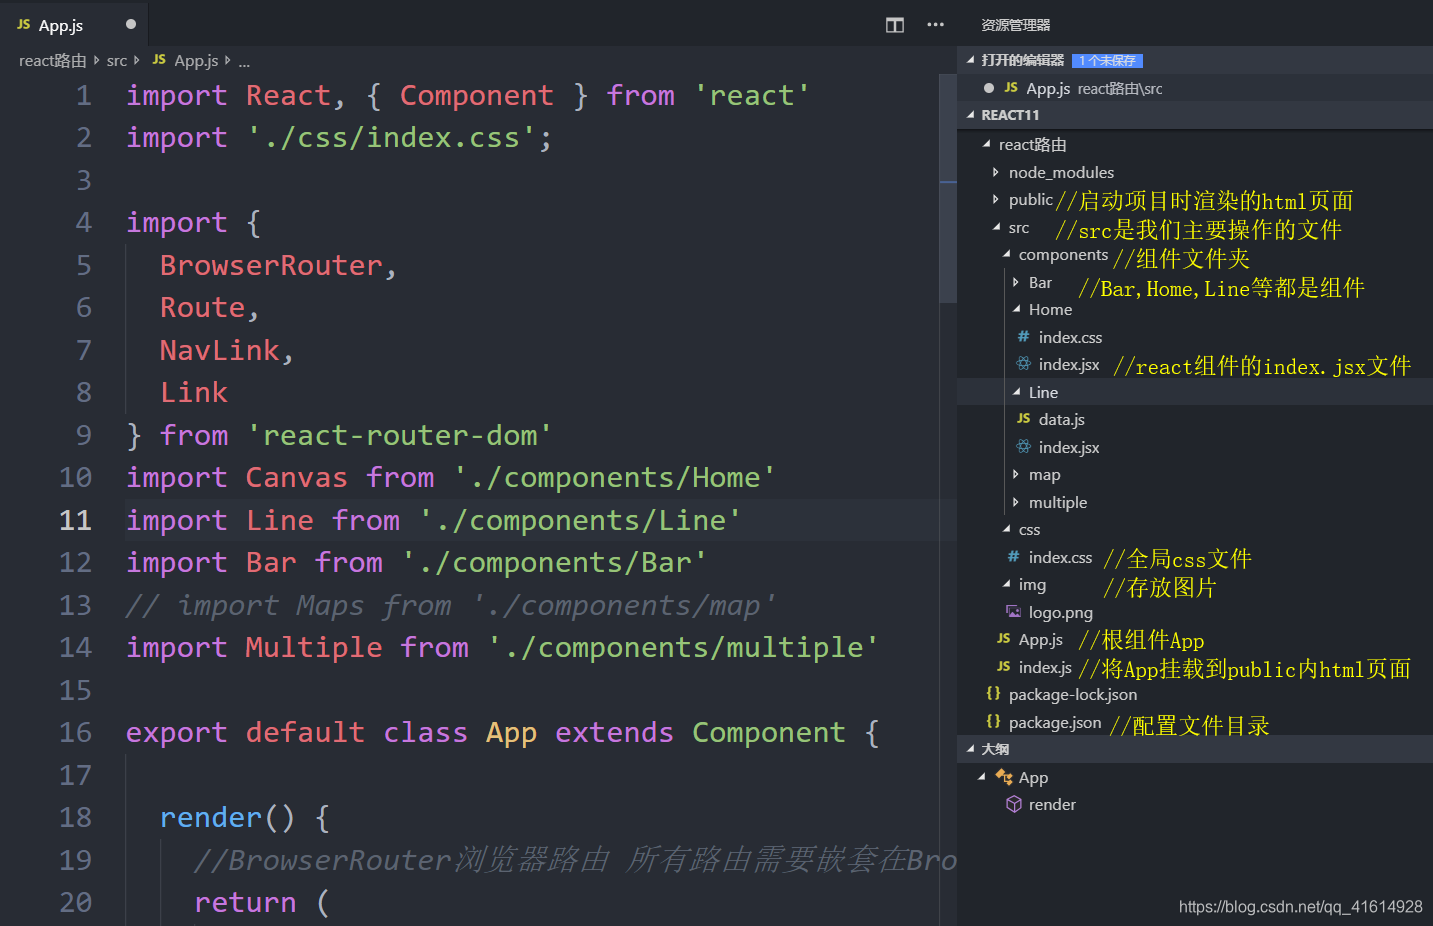
首先我们来看一下App根组件内的路由策略写法:
BrowerserRouter 标签
它的原理是使用HTML .5 history API (pushState, replaceState,
popState)来使你的内容随着ur动态改变的,如果放在一级目录下给BrowerserRouter增加个属性
Switch 标签
会用来包裹Route,它里面不能放其他htmI元素, 用来只显示一个路由
Route 标签
控制路径对应显示的组件 标签属性有exact、path以及component
exact是严格匹配,控制匹配到路径时不会再继续向下匹配
path是标识路由的路径 /path/:id路由参数
component则表示路径对应显示的组件
Link 与 Navl .ink 标签
两者都是可以控制路由跳转的 NavLink的api更多 Link标签有to属性
to可以接受string或者 个object, 来控制url
import React, { Component } from 'react'
import './css/index.css';

import {
  BrowserRouter,
  Route,
  Switch,
  NavLink,
  Link
} from 'react-router-dom'
import Canvas from './components/Home'
import Line from './components/Line'
import Bar from './components/Bar'
import Multiple from './components/multiple'

export default class App extends Component {

  render() {
    //BrowserRouter浏览器路由 所有路由需要嵌套在BrowserRouter标签内
    return (
      <BrowserRouter>
        <div className={'demo'}>
          <div className={'menu'}>
            <div className={'logo'}>
              <img src={require('./img/logo.png')} width='100%' alt="" />
            </div>
            <div className={'side_nav'}>
              <ul>
                <li><NavLink to='/'>嵌套饼图</NavLink></li>
                <li><NavLink to='/bar'>柱状图</NavLink></li>
                <li><NavLink to='/canvas'>Cavas下雨</NavLink></li>
                <li><NavLink to='/multiple'>多雷达图</NavLink></li>
              </ul>
            </div>
          </div>
          <div className={'content'}>
            <div className={'con_top_nav'}>
              <ul>
                <li><Link to='/'>用户名</Link></li>
                <li><Link to='/'>样式一</Link></li>
                <li><Link to='/'>样式二</Link></li>
                <li><Link to='/'>样式三</Link></li>
                <li><Link to='/'>样式四</Link></li>
              </ul>
            </div>
            <div className={'show_con'}>
              <Route exact path='/' component={Line} />
              <Route  path='/canvas' component={Canvas} />
              <Route path='/bar' component={Bar} />
              <Route path='/multiple' component={Multiple} />
            </div>
          </div>

        </div>
      </BrowserRouter>
    )
  }
}
全局css代码:
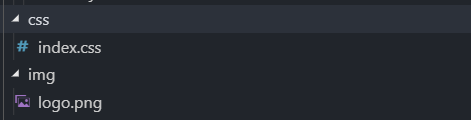
logo.png图片可以自行设置一个
*{
    margin:0;
    padding:0;
}

html,body{
    width:100%;
    height:100%;
}
ul,ol{
    list-style-type:none;
}
#root{
    overflow: hidden;
    height:100%;
}
.demo{
    display: flex;
    width:100%;
    height:100%;
}
.menu{
    width:250px;
    height:100%;
    background-color: #2d2d36;
}
.logo{
    background-color:#222;
    cursor: pointer;
}

.menu .side_nav{
    text-align: center;
    line-height: 50px;
}
.menu .side_nav ul{
    padding-top:30px;
}
.menu .side_nav ul li a{
    color:#fff;
    font-size:20px;
    text-decoration: none;
}


.content{
    width:100%;
    height:100%;
}
.content .con_top_nav{
    height:65px;
    background-color: #151c31;
}
.content .con_top_nav ul{
    float:right;
    /* background-color: #0ff; */
    margin-right:50px;
}
.content .con_top_nav ul li{
    float:left;
    width:60px;
    line-height:62px;
    /* background-color: #ff0000; */
    text-align:center;
    padding:0 10px;
    color:#fff;
}
.content .con_top_nav ul li a{
    color:#fff;
    text-decoration: none;
}
/* 下面左边的内容显示区 */
.content .container{
    position: relative;
    width:100%;
    height:850px;
}
.colorW{
    background-color: #fff;
}
.colorF{
    background-color: #f3f3f3;
}
Package.json配置文件详情如下:
{
  "name": "myapp1",
  "version": "0.1.0",
  "private": true,
  "dependencies": {
    "echarts": "^4.2.1",
    "react": "^16.8.6",
    "react-dom": "^16.8.6",
    "react-router-dom": "^5.0.1",
    "react-scripts": "3.0.1"
  },
  "scripts": {
    "start": "react-scripts start",
    "build": "react-scripts build",
    "test": "react-scripts test",
    "eject": "react-scripts eject"
  },
  "eslintConfig": {
    "extends": "react-app"
  },
  "browserslist": {
    "production": [
      ">0.2%",
      "not dead",
      "not op_mini all"
    ],
    "development": [
      "last 1 chrome version",
      "last 1 firefox version",
      "last 1 safari version"
    ]
  }
}
最后我们将所有的组件编写完成!
1. Bar组件:(条形饼图)
三个图片可自行引入
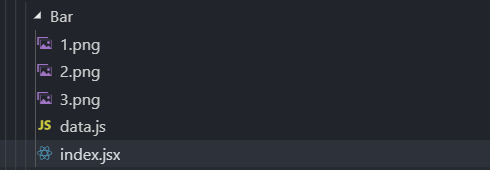
Bar组件 data.js代码如下:
option = {
  backgroundColor: {
    type: 'pattern',
    image: canvas,
    repeat: 'repeat'
  },
  tooltip: {},
  title: [{
    text: '在线构建',
    subtext: '总计 ' + builderJson.all,
    x: '25%',
    textAlign: 'center'
  }, {
    text: '各版本下载',
    subtext: '总计 ' + Object.keys(downloadJson).reduce(function (all, key) {
      return all + downloadJson[key];
    }, 0),
    x: '75%',
    textAlign: 'center'
  }, {
    text: '主题下载',
    subtext: '总计 ' + Object.keys(themeJson).reduce(function (all, key) {
      return all + themeJson[key];
    }, 0),
    x: '75%',
    y: '50%',
    textAlign: 'center'
  }],
  grid: [{
    top: 50,
    width: '50%',
    bottom: '45%',
    left: 10,
    containLabel: true
  }, {
    top: '55%',
    width: '50%',
    bottom: 0,
    left: 10,
    containLabel: true
  }],
  xAxis: [{
    type: 'value',
    max: builderJson.all,
    splitLine: {
      show: false
    }
  }, {
    type: 'value',
    max: builderJson.all,
    gridIndex: 1,
    splitLine: {
      show: false
    }
  }],
  yAxis: [{
    type: 'category',
    data: Object.keys(builderJson.charts),
    axisLabel: {
      interval: 0,
      rotate: 30
    },
    splitLine: {
      show: false
    }
  }, {
    gridIndex: 1,
    type: 'category',
    data: Object.keys(builderJson.components),
    axisLabel: {
      interval: 0,
      rotate: 30
    },
    splitLine: {
      show: false
    }
  }],
  series: [{
    type: 'bar',
    stack: 'chart',
    z: 3,
    label: {
      normal: {
        position: 'right',
        show: true
      }
    },
    data: Object.keys(builderJson.charts).map(function (key) {
      return builderJson.charts[key];
    })
  }, {
    type: 'bar',
    stack: 'chart',
    silent: true,
    itemStyle: {
      normal: {
        color: '#eee'
      }
    },
    data: Object.keys(builderJson.charts).map(function (key) {
      return builderJson.all - builderJson.charts[key];
    })
  }, {
    type: 'bar',
    stack: 'component',
    xAxisIndex: 1,
    yAxisIndex: 1,
    z: 3,
    label: {
      normal: {
        position: 'right',
        show: true
      }
    },
    data: Object.keys(builderJson.components).map(function (key) {
      return builderJson.components[key];
    })
  }, {
    type: 'bar',
    stack: 'component',
    silent: true,
    xAxisIndex: 1,
    yAxisIndex: 1,
    itemStyle: {
      normal: {
        color: '#eee'
      }
    },
    data: Object.keys(builderJson.components).map(function (key) {
      return builderJson.all - builderJson.components[key];
    })
  }, {
    type: 'pie',
    radius: [0, '30%'],
    center: ['75%', '25%'],
    data: Object.keys(downloadJson).map(function (key) {
      return {
        name: key.replace('.js', ''),
        value: downloadJson[key]
      }
    })
  }, {
    type: 'pie',
    radius: [0, '30%'],
    center: ['75%', '75%'],
    data: Object.keys(themeJson).map(function (key) {
      return {
        name: key.replace('.js', ''),
        value: themeJson[key]
      }
    })
  }]
}
Bar组件 index.jsx代码如下:
import React, { Component } from 'react'
import echarts from 'echarts'
export default class index extends Component {
  componentDidMount() {

    // 基于准备好的dom,初始化echarts实例
    var myChart = echarts.init(document.getElementById('main'));
    var option;
    var builderJson = {
      "all": 10887,
      "charts": {
        "map": 3237,
        "lines": 2164,
        "bar": 7561,
        "line": 7778,
        "pie": 7355,
        "scatter": 2405,
        "candlestick": 1842,
        "radar": 2090,
        "heatmap": 1762,
        "treemap": 1593,
        "graph": 2060,
        "boxplot": 1537,
        "parallel": 1908,
        "gauge": 2107,
        "funnel": 1692,
        "sankey": 1568
      },
      "components": {
        "geo": 2788,
        "title": 9575,
        "legend": 9400,
        "tooltip": 9466,
        "grid": 9266,
        "markPoint": 3419,
        "markLine": 2984,
        "timeline": 2739,
        "dataZoom": 2744,
        "visualMap": 2466,
        "toolbox": 3034,
        "polar": 1945
      },
      "ie": 9743
    };

    var downloadJson = {
      "echarts.min.js": 17365,
      "echarts.simple.min.js": 4079,
      "echarts.common.min.js": 6929,
      "echarts.js": 14890
    };

    var themeJson = {
      "dark.js": 1594,
      "infographic.js": 925,
      "shine.js": 1608,
      "roma.js": 721,
      "macarons.js": 2179,
      "vintage.js": 1982
    };

    var waterMarkText = 'ECHARTS';

    var canvas = document.createElement('canvas');
    var ctx = canvas.getContext('2d');
    canvas.width = canvas.height = 100;
    ctx.textAlign = 'center';
    ctx.textBaseline = 'middle';
    ctx.globalAlpha = 0.08;
    ctx.font = '20px Microsoft Yahei';
    ctx.translate(50, 50);
    ctx.rotate(-Math.PI / 4);
    ctx.fillText(waterMarkText, 0, 0);

    option = {
      backgroundColor: {
        type: 'pattern',
        image: canvas,
        repeat: 'repeat'
      },
      tooltip: {},
      title: [{
        text: '在线构建',
        subtext: '总计 ' + builderJson.all,
        x: '25%',
        textAlign: 'center'
      }, {
        text: '各版本下载',
        subtext: '总计 ' + Object.keys(downloadJson).reduce(function (all, key) {
          return all + downloadJson[key];
        }, 0),
        x: '75%',
        textAlign: 'center'
      }, {
        text: '主题下载',
        subtext: '总计 ' + Object.keys(themeJson).reduce(function (all, key) {
          return all + themeJson[key];
        }, 0),
        x: '75%',
        y: '50%',
        textAlign: 'center'
      }],
      grid: [{
        top: 50,
        width: '50%',
        bottom: '45%',
        left: 10,
        containLabel: true
      }, {
        top: '55%',
        width: '50%',
        bottom: 0,
        left: 10,
        containLabel: true
      }],
      xAxis: [{
        type: 'value',
        max: builderJson.all,
        splitLine: {
          show: false
        }
      }, {
        type: 'value',
        max: builderJson.all,
        gridIndex: 1,
        splitLine: {
          show: false
        }
      }],
      yAxis: [{
        type: 'category',
        data: Object.keys(builderJson.charts),
        axisLabel: {
          interval: 0,
          rotate: 30
        },
        splitLine: {
          show: false
        }
      }, {
        gridIndex: 1,
        type: 'category',
        data: Object.keys(builderJson.components),
        axisLabel: {
          interval: 0,
          rotate: 30
        },
        splitLine: {
          show: false
        }
      }],
      series: [{
        type: 'bar',
        stack: 'chart',
        z: 3,
        label: {
          normal: {
            position: 'right',
            show: true
          }
        },
        data: Object.keys(builderJson.charts).map(function (key) {
          return builderJson.charts[key];
        })
      }, {
        type: 'bar',
        stack: 'chart',
        silent: true,
        itemStyle: {
          normal: {
            color: '#eee'
          }
        },
        data: Object.keys(builderJson.charts).map(function (key) {
          return builderJson.all - builderJson.charts[key];
        })
      }, {
        type: 'bar',
        stack: 'component',
        xAxisIndex: 1,
        yAxisIndex: 1,
        z: 3,
        label: {
          normal: {
            position: 'right',
            show: true
          }
        },
        data: Object.keys(builderJson.components).map(function (key) {
          return builderJson.components[key];
        })
      }, {
        type: 'bar',
        stack: 'component',
        silent: true,
        xAxisIndex: 1,
        yAxisIndex: 1,
        itemStyle: {
          normal: {
            color: '#eee'
          }
        },
        data: Object.keys(builderJson.components).map(function (key) {
          return builderJson.all - builderJson.components[key];
        })
      }, {
        type: 'pie',
        radius: [0, '30%'],
        center: ['75%', '25%'],
        data: Object.keys(downloadJson).map(function (key) {
          return {
            name: key.replace('.js', ''),
            value: downloadJson[key]
          }
        })
      }, {
        type: 'pie',
        radius: [0, '30%'],
        center: ['75%', '75%'],
        data: Object.keys(themeJson).map(function (key) {
          return {
            name: key.replace('.js', ''),
            value: themeJson[key]
          }
        })
      }]
    }

    // 绘制图表

    myChart.setOption(option)

  }

  render() {
    return (
      <div className={'container colorF'} id='main'>
        <canvas></canvas>
      </div>
    )
  }
}
Home组件:(canvas下雨效果)
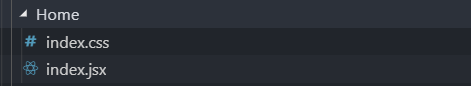
Home组件 index.css代码如下:
html,body,canvas{
    width: 100%;
    height: 100%;
}
body{
    margin: 0;
    background: #222;
    overflow: hidden;
    position: relative;
    z-index: 0;
}
canvas{
    position: absolute;
    top: 0;
    left: 0;
}
canvas:nth-child(1){z-index: 100}
canvas:nth-child(2){z-index: 10}
canvas:nth-child(3){z-index: 1}
Home组件 index.jsx代码如下:
import React, { Component } from 'react'
import './index.css'

export default class index extends Component {
  //页面渲染后调用
  componentDidMount() {
    let oC = document.querySelectorAll('canvas'),
      cxt1 = oC[0].getContext('2d'),  // 绘制线性的 雨水
      cxt2 = oC[1].getContext('2d'),  // 绘制 雨点
      cxt3 = oC[2].getContext('2d'),  // 雷电
      w,
      h,
      rainThroughNum = 500, // 雨线的数量
      speedRainThrough = 25,  // 雨水速度
      rainThrough = [], // 雨水
      rainNum = 500,  // 雨点的数量
      rain = [],   // 雨点
      lightning = [],  // 雷电
      lightTimeCuttent = 0,
      lightTimeTotal = 0

    // 0。 大小自适应
    resize()
    window.addEventListener('resize', resize)
    function resize() {
      oC.forEach((item, index) => {
        w = item.width = window.innerWidth
        h = item.height = window.innerHeight
      })
    }
    // min <= n <= max 的随机小数
    function random(min, max) {
      return Math.random() * (max - min + 1) + min
    }

    // 2. 创建雨水
    function createRainThrough() {
      for (let i = 0; i < rainThroughNum; i++) {
        rainThrough[i] = {
          x: random(0, w),
          y: random(0, h),
          length: Math.floor(random(1, 800)),
          opacity: Math.random() * 0.2,
          xs: random(-2, 2),
          ys: random(10, 20)
        }
      }
    }

    // 3. 创建雨点
    function createRain() {
      for (let i = 0; i < rainNum; i++) {
        rain[i] = {
          x: Math.random() * w,
          y: Math.random() * h,
          l: Math.random(),
          xs: Math.random() * 4 - 2,
          ys: Math.random() * 10 + 10
        }
      }
    }


    // 利用函数式编程
    // 1. init 初始化 准备工作
    init()
    function init() {
      // 雨水 + 雨点的 配置信息
      // 2. 创建雨水
      createRainThrough()
      // 3. 创建雨点
      createRain()
      window.addEventListener('resize', createRainThrough)
    }

    // 4. 动画
    animLoop()
    function animLoop() {
      // 5. 绘制雨水
      animateRainThrough()
      // 6. 绘制雨点
      animateRain()

      // 8. 绘制雷电
      animateLightning()
      requestAnimationFrame(animLoop)
    }

    // 5. 雨水动画
    function clearCanvas1() { cxt1.clearRect(0, 0, w, h) }
    function animateRainThrough() {
      clearCanvas1()
      // 判断 雨水的边界
      for (let i = 0; i < rainThroughNum; i++) {
        if (rainThrough[i].y >= h) {
          rainThrough[i].y = h - rainThrough[i].y - rainThrough[i].length
        } else {
          rainThrough[i].y += speedRainThrough
        }
        // 6. 绘制雨水
        drawRainThrough(i)
      }
    }

    function drawRainThrough(i) {
      cxt1.beginPath()
      let bg = cxt1.createLinearGradient(0, rainThrough[i].y, 0, rainThrough[i].y + rainThrough[i].length)
      bg.addColorStop(0, 'rgba(255,255,255,0)')
      bg.addColorStop(1, 'rgba(255,255,255,' + rainThrough[i].opacity + ')')

      cxt1.fillStyle = bg
      cxt1.fillRect(rainThrough[i].x, rainThrough[i].y, 1, rainThrough[i].length)
      cxt1.fill()
    }

    // 6. 动画雨点
    function createCanvas2() {
      cxt2.clearRect(0, 0, w, h)
    }
    function animateRain() {
      createCanvas2()
      for (let i = 0; i < rainNum; i++) {
        rain[i].x += rain[i].xs
        rain[i].y += rain[i].ys

        if (rain[i].x > w || rain[i].y > h) {
          rain[i].x = Math.random() * w
          rain[i].y = 0
        }

        drawRain(i)
      }
    }
    // 7. 绘制雨点
    function drawRain(i) {

      cxt2.beginPath()
      cxt2.moveTo(rain[i].x, rain[i].y)
      cxt2.lineTo(rain[i].x + rain[i].l * rain[i].xs, rain[i].y + rain[i].l * rain[i].ys)
      cxt2.strokeStyle = 'rgba(174,194,224,0.5)'
      cxt2.lineWidth = 1
      cxt2.lineCap = 'round'
      cxt2.stroke()
    }

    // 8. 动画雷电
    function clearCanvas3() {
      // cxt3.globalCompositeOperation = 'destination-out'
      cxt3.fillStyle = 'rgba(0,0,0,' + random(1, 30) / 100 + ')'
      // cxt3.fillRect(0,0,w,h)
      cxt3.clearRect(0, 0, w, h)
      // cxt3.globalCompositeOperation = 'source-over'
    }
    function animateLightning() {
      clearCanvas3()

      // 不要生成一大遍的雷霆
      lightTimeCuttent++
      if (lightTimeCuttent >= lightTimeTotal) {
        // 创建雷电的配置信息
        createLightning()
        lightTimeCuttent = 0
        lightTimeTotal = random(100, 200)
      }
      // 绘制雷电到canvas画面上面
      drawLightning()
    }

    // 9. 创建雷电
    function createLightning() {
      // 雷霆的配置信息
      // 绘制雷电的起来坐标
      let x = random(100, w - 100)
      let y = random(0, h / 4)

      let createCount = random(1, 3)
      for (let i = 0; i < createCount; i++) {
        lightning.push({
          x: x,
          y: y,
          xRange: random(5, 30),  // 雷霆的范围
          yRange: random(10, 25),
          path: [{
            x: x,   // 绘制雷电的路径x y
            y: y
          }],
          pathLimit: random(40, 50)    // 路径的极限
        })
      }
    }

    // 10. 绘制雷霆
    function drawLightning() {
      for (let i = 0; i < lightning.length; i++) {
        let light = lightning[i]
        light.path.push({
          x: light.path[light.path.length - 1].x + (random(0, light.xRange) - (light.xRange / 2)),
          y: light.path[light.path.length - 1].y + (random(0, light.yRange))
        })
        cxt3.strokeStyle = 'rgba(255,255,255,0.1)'
        cxt3.lineWidth = 3

        if (Math.floor(random(0, 15)) === 2) {
          // console.log(6)
          cxt3.lineWidth = 2
        }
        if (Math.floor(random(0, 30)) === 4) {
          // console.log(8)
          cxt3.lineWidth = 6
        }

        // 会一直 push 配置信息到 lightning 所以要清除前面的闪电 只留一个
        if (light.path.length > light.pathLimit) {
          lightning.splice(i, 1)
        }

        cxt3.beginPath()
        cxt3.moveTo(light.x, light.y)
        for (let p = 0; p < light.path.length; p++) {
          cxt3.lineTo(light.path[p].x, light.path[p].y)
        }

        if (Math.floor(random(0, 30)) === 1) {
          // console.log(123)
          cxt3.fillStyle = 'rgba(255,255,255,' + random(1, 3) / 10 + ')'
          // cxt3.fillStyle = 'rgba(255,0,0,0.03)'
          cxt3.fillRect(0, 0, w, h)
        }

        cxt3.stroke()
      }
    }
  }

  render() {
    return (
      <div className={'container'} >
        <canvas></canvas>
        <canvas></canvas>
        <canvas></canvas>
      </div>
    )
  }
}
Line组件:(嵌套饼图)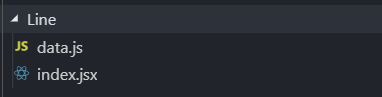
Line组件 data.js代码如下:
export const option = {
  tooltip: {
    trigger: 'item',
    formatter: "{a} <br/>{b}: {c} ({d}%)"
  },
  legend: {
    orient: 'vertical',
    x: 'left',
    data: ['直达', '营销广告', '搜索引擎', '邮件营销', '联盟广告', '视频广告', '百度', '谷歌', '必应', '其他']
  },
  series: [
    {
      name: '访问来源',
      type: 'pie',
      selectedMode: 'single',
      radius: [0, '30%'],

      label: {
        normal: {
          position: 'inner'
        }
      },
      labelLine: {
        normal: {
          show: false
        }
      },
      data: [
        { value: 335, name: '直达', selected: true },
        { value: 679, name: '营销广告' },
        { value: 1548, name: '搜索引擎' }
      ]
    },
    {
      name: '访问来源',
      type: 'pie',
      radius: ['40%', '55%'],
      label: {
        normal: {
          formatter: '{a|{a}}{abg|}\n{hr|}\n  {b|{b}:}{c}  {per|{d}%}  ',
          backgroundColor: '#eee',
          borderColor: '#aaa',
          borderWidth: 1,
          borderRadius: 4,
          // shadowBlur:3,
          // shadowOffsetX: 2,
          // shadowOffsetY: 2,
          // shadowColor: '#999',
          // padding: [0, 7],
          rich: {
            a: {
              color: '#999',
              lineHeight: 22,
              align: 'center'
            },
            // abg: {
            //     backgroundColor: '#333',
            //     width: '100%',
            //     align: 'right',
            //     height: 22,
            //     borderRadius: [4, 4, 0, 0]
            // },
            hr: {
              borderColor: '#aaa',
              width: '100%',
              borderWidth: 0.5,
              height: 0
            },
            b: {
              fontSize: 16,
              lineHeight: 33
            },
            per: {
              color: '#eee',
              backgroundColor: '#334455',
              padding: [2, 4],
              borderRadius: 2
            }
          }
        }
      },
      data: [
        { value: 335, name: '直达' },
        { value: 310, name: '邮件营销' },
        { value: 234, name: '联盟广告' },
        { value: 135, name: '视频广告' },
        { value: 1048, name: '百度' },
        { value: 251, name: '谷歌' },
        { value: 147, name: '必应' },
        { value: 102, name: '其他' }
      ]
    }
  ]
};
Line组件 index.jsx代码如下:
import React, { Component } from 'react'
import echarts from 'echarts'
import { option } from './data.js'
/*

    在 webpack 中使用 ECharts
        1.npm 安装 ECharts
            npm install echarts --save
        2.
*/

export default class index extends Component {
  componentDidMount() {
    // 基于准备好的dom,初始化echarts实例
    var myChart = echarts.init(document.getElementById('main'));
    // 绘制图表
    myChart.setOption(option)
  }

  render() {
    return (
      <div className={'container colorW'} id={'main'}>
      </div>
    )
  }
}
multiple组件:(多雷达图)
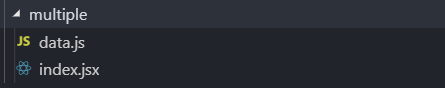
multiple组件 data.js代码如下:
export const option = {
  title: {
    text: '多雷达图'
  },
  tooltip: {
    trigger: 'axis'
  },
  legend: {
    x: 'center',
    data: ['某软件', '某主食手机', '某水果手机', '降水量', '蒸发量']
  },
  radar: [
    {
      indicator: [
        { text: '品牌', max: 100 },
        { text: '内容', max: 100 },
        { text: '可用性', max: 100 },
        { text: '功能', max: 100 }
      ],
      center: ['25%', '40%'],
      radius: 80
    },
    {
      indicator: [
        { text: '外观', max: 100 },
        { text: '拍照', max: 100 },
        { text: '系统', max: 100 },
        { text: '性能', max: 100 },
        { text: '屏幕', max: 100 }
      ],
      radius: 80,
      center: ['50%', '60%'],
    },
    {
      indicator: (function () {
        var res = [];
        for (var i = 1; i <= 12; i++) {
          res.push({ text: i + '月', max: 100 });
        }
        return res;
      })(),
      center: ['75%', '40%'],
      radius: 80
    }
  ],
  series: [
    {
      type: 'radar',
      tooltip: {
        trigger: 'item'
      },
      itemStyle: { normal: { areaStyle: { type: 'default' } } },
      data: [
        {
          value: [60, 73, 85, 40],
          name: '某软件'
        }
      ]
    },
    {
      type: 'radar',
      radarIndex: 1,
      data: [
        {
          value: [85, 90, 90, 95, 95],
          name: '某主食手机'
        },
        {
          value: [95, 80, 95, 90, 93],
          name: '某水果手机'
        }
      ]
    },
    {
      type: 'radar',
      radarIndex: 2,
      itemStyle: { normal: { areaStyle: { type: 'default' } } },
      data: [
        {
          name: '降水量',
          value: [2.6, 5.9, 9.0, 26.4, 28.7, 70.7, 75.6, 82.2, 48.7, 18.8, 6.0, 2.3],
        },
        {
          name: '蒸发量',
          value: [2.0, 4.9, 7.0, 23.2, 25.6, 76.7, 35.6, 62.2, 32.6, 20.0, 6.4, 3.3]
        }
      ]
    }
  ]
};
multiple组件 index.jsx代码如下:
import React, { Component } from 'react'
import echarts from 'echarts'
import { option } from './data.js'


export default class index extends Component {

  componentDidMount() {
    // 基于准备好的dom,初始化echarts实例
    var myChart = echarts.init(document.getElementById('main'));
    // 绘制图表
    myChart.setOption(option)
  }

  render() {
    return (
      <div className={'container colorW'} id={'main'}>

      </div>
    )
  }
}


 2350
2350

 被折叠的 条评论
为什么被折叠?
被折叠的 条评论
为什么被折叠?
 到【灌水乐园】发言


