上一篇我们介绍了使用Hystrix Dashboard来展示Hystrix用于熔断的各项度量指标。通过Hystrix Dashboard,我们可以方便的查看服务实例的综合情况,比如:服务调用次数、服务调用延迟等。但是仅通过Hystrix Dashboard我们只能实现对服务单个实例的数据展现,在生产环境我们的服务是肯定需要做高可用的,那么对于多实例的情况,我们就需要将这些度量指标数据进行聚合。下面,在本篇中,我们就来介绍一下另外一个工具:Turbine。
准备工作
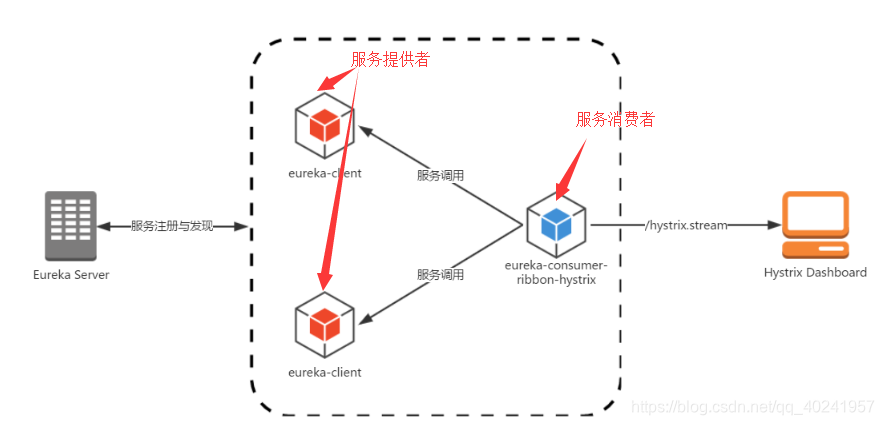
在开始使用Turbine之前,我们先回顾一下上一篇中实现的架构,如下图所示:

其中,我们构建的内容包括:
- eureka-server:服务注册中心
- eureka-client:服务提供者
- eureka-consumer-ribbon-hystrix:使用ribbon和hystrix实现的服务消费者
- hystrix-dashboard(类似数据结果统计盘):用于展示eureka-consumer-ribbon-hystrix服务的Hystrix数据
动手试一试
下面,我们将在上述架构基础上,引入Turbine来对服务的Hystrix数据进行聚合展示。这里我们将分别介绍两种聚合方式。
通过HTTP收集聚合
具体实现步骤如下:
- 创建一个标准的Spring Boot工程,命名为:turbine。
- 编辑pom.xml,具体依赖内容如下:
<parent>
	<groupId>org.springframework.cloud</groupId>
	<artifactId>spring-cloud-starter-parent</artifactId>
	<version>Dalston.SR1</version>
	<relativePath /> <!-- lookup parent from repository -->
</parent>
<dependencies>
	<dependency>
		<groupId>org.springframework.cloud</groupId>
		<artifactId>spring-cloud-starter-turbine</artifactId>
	</dependency>
	<dependency>
		<groupId>org.springframework.boot</groupId>
		<artifactId>spring-boot-starter-actuator</artifactId>
	</dependency>
</dependencies>
未完待续…


 本文介绍如何使用Turbine工具聚合Hystrix监控数据,实现对多实例服务的度量指标数据聚合展示。通过HTTP方式收集聚合数据,并在生产环境中实现服务的高可用。


 被折叠的 条评论
为什么被折叠?


