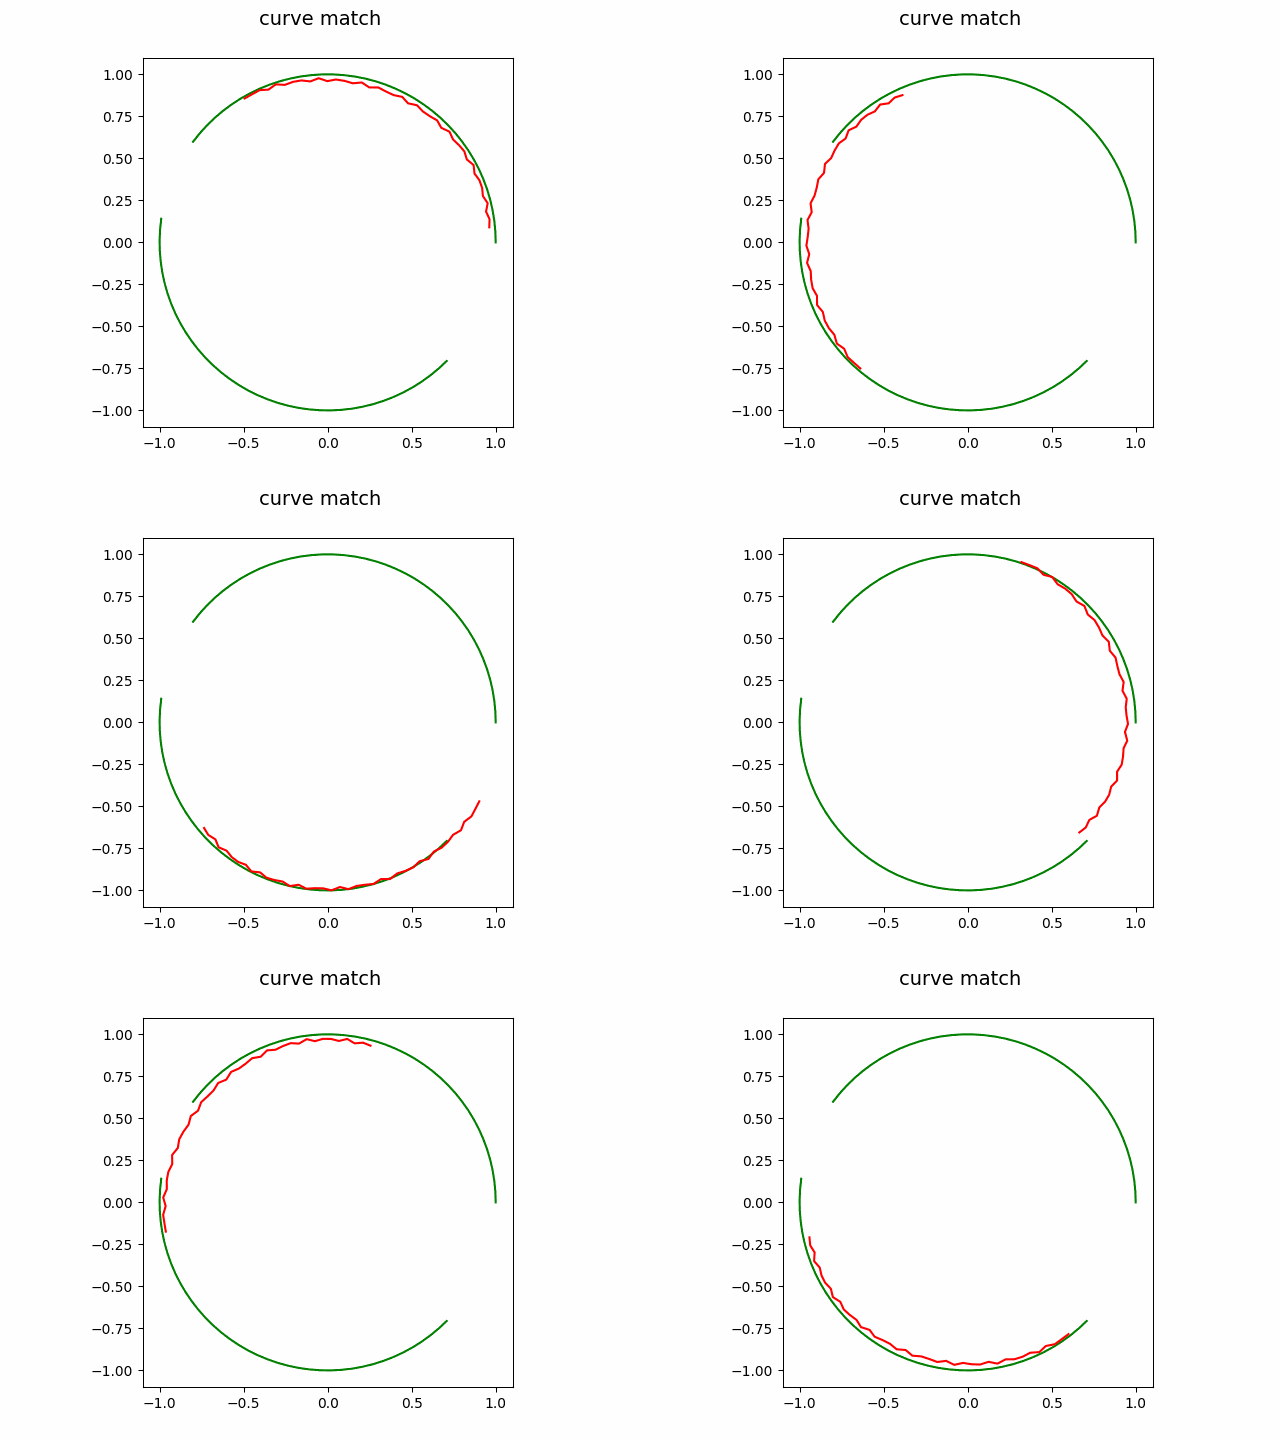
要点:
1. 使用了matplotlib绘图生成动画。
2. 使用shapely(libgeos的python封装)完成几何计算。
3. 使用umeyama算法实现欧式变换。
代码:
from typing import Union

from matplotlib import pyplot as plt, animation
from matplotlib.animation import PillowWriter
from shapely.geometry import LineString, Point, MultiLineString
from shapely.ops import nearest_points
import numpy as np
import unittest


def umeyama(src: np.ndarray, target: np.ndarray, scaling=False):
    """
    umeyama 变换
    :param src: m x n 坐标矩阵,m是空间维度,n是点数
    :param target: 同上
    :param scaling: 暂时不用
    :return: m+1 维的变换矩阵
    """
    m, n = src.shape
    src_mean = np.mean(src, axis=1)
    target_mean = np.mean(target, axis=1)
    one_over_n = 1 / n

    src_demean = np.array([src[0, :] - src_mean[0], src[1, :] - src_mean[1]])
    dst_demean = np.array([target[0, :] - target_mean[0], target[1, :] - target_mean[1]])

    # src_var_x = (src_demean**2).sum(axis=1) * one_over_n
    sigma = one_over_n * dst_demean @ src_demean.transpose()
    Rt = np.eye(m + 1)
    S = np.ones(m)
    u, s, vh = np.linalg.svd(sigma)
    if np.linalg.det(u) * np.linalg.det(vh) < 0:
        S[m - 1] = -1
    Rt[:m, :m] = u @ np.diag(S) @ vh
    Rt[:m, m] = target_mean - Rt[:m, :m] @ src_mean
    return Rt


class Traj:
    def __init__(self, shp:LineString):
        self._coords = np.array(shp.coords)
        self._num_points = self._coords.shape[0]

    def aug_coords(self):
        return np.hstack([self._coords, np.ones((self._num_points, 1))])

    def shape(self):
        return LineString(self._coords)

    def heading(self):
        dv = self._coords[-1, :] - self._coords[-2, :]
        return dv / np.linalg.norm(dv)

    def transform(self, dx, dy):
        self._coords += [dx, dy]

    def transform_rt(self, rt):
        self._coords = (self.aug_coords() @ rt.transpose())[:,:2]

    def find_closest_points(self, map, tolerence):
        closest_points = np.zeros(self._coords.shape)
        good_idx = []
        for idx, p in enumerate(self._coords):
            cp = nearest_points(Point(p), map.shape())
            closest_points[idx:] = cp[1].x, cp[1].y
            if cp[0].distance(cp[1]) < tolerence:
                good_idx.append(idx)
        return closest_points, good_idx

    def attach(self, target: "Map", forward=True, axes=None):
        cps,good_idx = self.find_closest_points(target, tolerence=0.3)
        rt = umeyama(self._coords[good_idx,:].transpose(), cps[good_idx,:].transpose())
        self.transform_rt(rt)
        # ns = snap(self.shape(), target.shape(), tolerance=0.3)
        # self._coords=np.array(ns.coords)

    def crawl(self, target: "Map", forward=True, axes=None):
        self.transform(*self.heading() * 0.1)
        self.attach(target,forward, axes)


class Map:
    def __init__(self, shps: Union[MultiLineString,LineString]):
        self._shape = shps

    def shape(self):
        return self._shape

    def plot(self, axes, c):
        for l in self.shape():
            axes.plot(*l.xy, c)


def move_along(floating_line:Traj, fixed_line:Map, forward=True, save=False):
    plt.ion()
    fig = plt.figure(1)
    axes = fig.gca()
    axes.set_aspect(1)
    fixed_line.plot(axes, "g")
    line = axes.plot(*floating_line.shape().xy, "r")[0]
    floating_line.attach(fixed_line, forward=True, axes=axes)
    line.set_data(*floating_line.shape().xy)

    def animate(frame_number):
        floating_line.crawl(fixed_line, forward=True, axes=axes)
        line.set_data(*floating_line.shape().xy)
        return line,
    if save:
        anim = animation.FuncAnimation(fig, animate, frames=200,
                                       interval=20, blit=True)
        fig.suptitle('curve match', fontsize=14)

        writer = PillowWriter(fps=25)
        anim.save("demo.gif", writer=writer)
    else:
        for i in range(1000):
            animate(0)
            plt.pause(0.1)


class TestCurveFit(unittest.TestCase):
    def test_001(self):
        theta = np.linspace(0, 2.5, 40)
        x = np.cos(theta)
        y = np.sin(theta)
        l1 = LineString([xy for xy in zip(x, y)])

        theta = np.linspace(3, 5.5, 40)
        x = np.cos(theta)
        y = np.sin(theta)
        l2 = LineString([xy for xy in zip(x, y)])
        la = MultiLineString([l1, l2])

        theta = np.linspace(0, 2, 40)
        r = 1 + np.sin(theta*50) * 0.01
        x = np.cos(theta) * r
        y = np.sin(theta) *r*0.93
        lb = LineString([xy for xy in zip(x, y)])

        traj_a = Map(la)
        traj_b = Traj(lb)
        move_along(traj_b, traj_a, save=True)
效果:


 被折叠的 条评论
为什么被折叠?


