


使用 matplotlib.tri 可视化三角网格
"A picture is worth a thousand words. "
——San Antonio Light
三角网格是有限元方法、数值模拟和计算机图形学中的基础工具之一。在本篇文章中,笔者将探讨如何使用 Python 的 matplotlib.tri 模块来可视化三角网格,包括添加节点和单元编号、样式调整以及绘制质心等功能,使图形更加直观和美观。
背景与应用
在有限元分析中,三角网格常用于离散化复杂几何形状的区域,以便对偏微分方程进行数值求解。有效的网格可视化工具可以帮助用户:
- 检查网格的生成质量。
- 验证节点编号及边界条件的设置。
- 对仿真结果进行后处理和展示。
这些操作能够在开发前期帮助研究人员快速进行代码调试和结果验证,对于提高工作效率很有帮助!

接下来,笔者将通过代码示例展示如何实现这些功能。
代码概览
以下是一个使用 matplotlib.tri 绘制三角网格的 Python 脚本。代码包括了网格样式化、节点和单元编号的标注,以及对质心的计算和显示。
import numpy as np
import matplotlib.pyplot as plt
import matplotlib.tri as tri

def plot_triangular_mesh(p, t):
    """
    根据节点坐标和三角形索引绘制三角网格,并进行样式化。

    参数:
    p (numpy.ndarray): 节点坐标,形状为 (n, 2)。
    t (numpy.ndarray): 三角形的节点索引,形状为 (m, 3)。
    """
    fig, ax = plt.subplots()

    # 创建 Triangulation 对象
    triang = tri.Triangulation(p[:, 0], p[:, 1], triangles=t)

    # 设置三角形颜色(统一设置为浅蓝色,笔者喜欢!)
    colors = 0.489 * np.ones(t.shape[0])

    ax.tripcolor(triang, facecolors=colors, cmap='Blues', edgecolors='black', linewidths=0.8)

    # 绘制红色节点
    ax.scatter(p[:, 0], p[:, 1], c='red', s=50, zorder=5)

    # 标注节点编号
    for i in range(p.shape[0]):
        ax.text(p[i, 0], p[i, 1], str(i), fontsize=10, ha='right', va='bottom', color='red')

    # 计算每个三角形的质心并标注单元编号
    centroids = np.mean(p[t], axis=1)
    for i in range(t.shape[0]):
        ax.text(centroids[i, 0], centroids[i, 1], str(i), fontsize=10, ha='center', va='center', color='black', fontweight='bold')

    # 设置坐标轴比例为等比例
    ax.set_aspect('equal')
    plt.grid(True)
    plt.xlabel('X')
    plt.ylabel('Y')
    plt.title('带节点和单元编号的三角网格')
    plt.show()

# 示例数据
points = np.array([
    [0, 0], [1, 0], [1, 1], [0, 1], [0.5, 0.5]
])
triangles = np.array([
    [0, 1, 4], [1, 2, 4], [2, 3, 4], [3, 0, 4]
])

plot_triangular_mesh(points, triangles)
代码解析
输入参数
p: 节点的二维坐标,形状为 ((n, 2))。points = np.array([ [0, 0], [1, 0], [1, 1], [0, 1], [0.5, 0.5] ])t: 三角形的节点索引,形状为 ((m, 3))。triangles = np.array([ [0, 1, 4], [1, 2, 4], [2, 3, 4], [3, 0, 4] ])
为了读者方便,这里我们也给出矩形区域三角网格生成代码:
import numpy as np
from scipy.spatial import Delaunay
def trimesh(x_start, x_end, y_start, y_end, n_x, n_y):
    # p: np*2,  t:nt*3
    h_x = (x_end - x_start) / n_x
    h_y = (y_end - y_start) / n_y
    X, Y = np.meshgrid(np.arange(x_start, x_end + h_x, h_x), np.arange(y_start, y_end + h_y, h_y))
    length = (n_x + 1) * (n_y + 1)
    x = X.flatten()
    y = Y.flatten()
    p = np.vstack((x, y)).T
    tri = Delaunay(p)
    t = tri.simplices
    return p, t
利用上述代码可以按照想要的分划粗细程度生成网格结构数据[p,t].
主要实现
1. Triangulation 对象
使用 matplotlib.tri.Triangulation 创建三角剖分对象:
triang = tri.Triangulation(p[:, 0], p[:, 1], triangles=t)
2. 三角形着色
通过 ax.tripcolor 设置三角形颜色,这里统一为浅蓝色:
colors = 0.489 * np.ones(t.shape[0])
3. 节点和单元编号
使用 ax.text 在网格上添加节点编号(红色)和单元编号(黑色):
# 节点编号
ax.text(p[i, 0], p[i, 1], str(i), fontsize=10, ha='right', va='bottom', color='red')

# 单元编号
centroids = np.mean(p[t], axis=1)
ax.text(centroids[i, 0], centroids[i, 1], str(i), fontsize=10, ha='center', va='center', color='black', fontweight='bold')
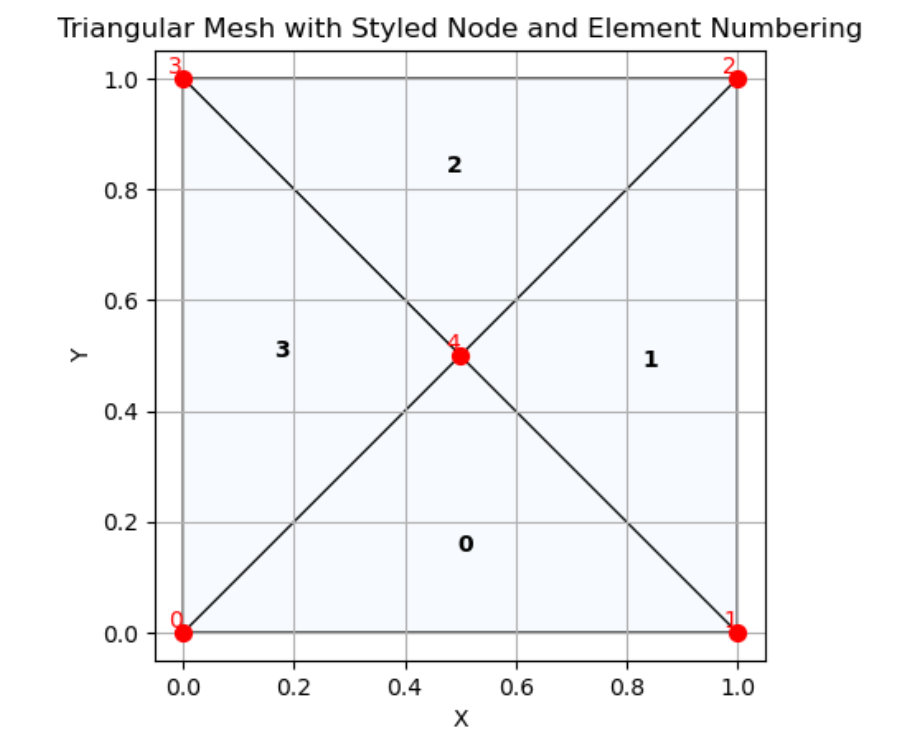
可视化结果
三角网格
运行脚本后,将看到:
- 带有黑色边界的三角网格。
- 红色的节点标记及其编号。
- 位于三角形中心的黑色单元编号。
自定义建议
- 动态着色:根据三角形面积或节点值对网格进行着色。
- 边界条件:对特定边界节点或单元添加不同的标注。
- 布局优化:将网格可视化与仿真结果结合,生成更复杂的多视图布局。
数学公式
计算三角形质心的方法:
质心
=
1
3
∑
i
=
1
3
p
i
\text{质心} = \frac{1}{3} \sum_{i=1}^3 \mathbf{p}_i
质心=31i=1∑3pi
总结
以上只是一种笔者喜欢的风格绘制。通过 matplotlib.tri,我们可以创建直观的三角网格图。这种可视化方法在数值仿真和图形展示中具有重要意义。各位读者可以尝试调整样式和标注(如网格背景,不同单元不同着色等等效果),以满足不同的应用需求。

本专栏致力于普及各种偏微分方程的不同数值求解方法,所有文章包含全部可运行代码。欢迎大家支持、关注!
作者 :计算小屋
个人主页 : 计算小屋的主页


 3万+
3万+

 被折叠的 条评论
为什么被折叠?
被折叠的 条评论
为什么被折叠?
 到【灌水乐园】发言


