


 本文详细介绍如何使用Highcharts库绘制折线图和饼图,包括设置时间轴、数据格式化、图表样式等关键步骤。
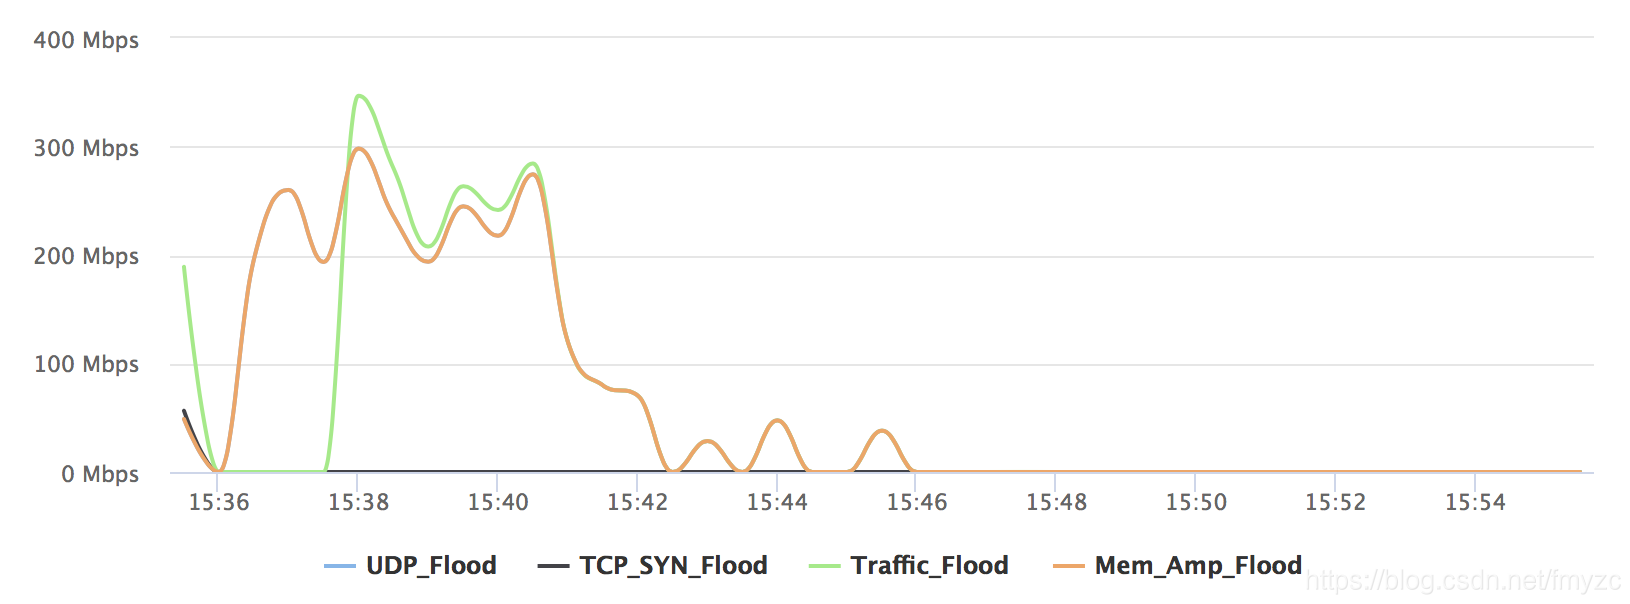
一.折线图(以时间为x轴)
先上一张效果图
直接上代码
function graph(data) {
        $('#container').highcharts({
            global:{
                useUTC:false
            },
            chart: {
                type: 'spline'

            },
            credits:{
                enabled:false
            },
            title: {
                text: ''
            },
            xAxis: {
                type: 'datetime',     //以时间为x轴
                dateTimeLabelFormats: {
                    day: '%H:%M'      //显示的时间格式,百度dateTimeLabelFormats可以找到更多格式
                }
            },
            yAxis: {
                title: {
                    text: ''
                },
                min:0,
                labels : { formatter:function (){ return this.value + 'Gbps(y轴单位)' ; } }
            },
            tooltip: {
                valueSuffix: 'Gbps(y轴单位)'
            },
            plotOptions: {
                spline: {
                    lineWidth: 2,
                    states: {
                        hover: {
                            lineWidth: 3
                        }
                    },
                    marker: {
                        enabled: false
                    }
                }
            },
            series: [
                {
                    name:'Traffic_Flood(折现图名称1)',

                    pointInterval:'30000(30s,x轴时间间隔,以毫秒为单位)',
                   pointStart:Date.UTC('2018(年)','10(月)','26(日)','12(时)','30(分)','30(秒)'),(开始时间)

pointEnd:Date.UTC('2018(年)','10(月)','26(日)','12(时)','40(分)','30(秒)'),(结束时间)

data:[1,2,3,4,5,……,19,20]  //y轴数据,例如1对应2018.10.26.12.30.30,20对应2018.10.26.12.40.30
                },
                {
                    name:'Traffic_Flood(折现图名称2)',

                    pointInterval:'30000(30s,x轴时间间隔,以毫秒为单位)',
                    pointStart:Date.UTC('2018(年)','10(月)','26(日)','12(时)','30(分)','30(秒)'),

pointEnd:Date.UTC('2018(年)','10(月)','26(日)','12(时)','40(分)','30(秒)'),

data:[1,2,3,4,5,……,19,20]  //y轴数据,例如1对应2018.10.26.12.30.30,20对应2018.10.26.12.40.30
                },……
            ]

        });
    }
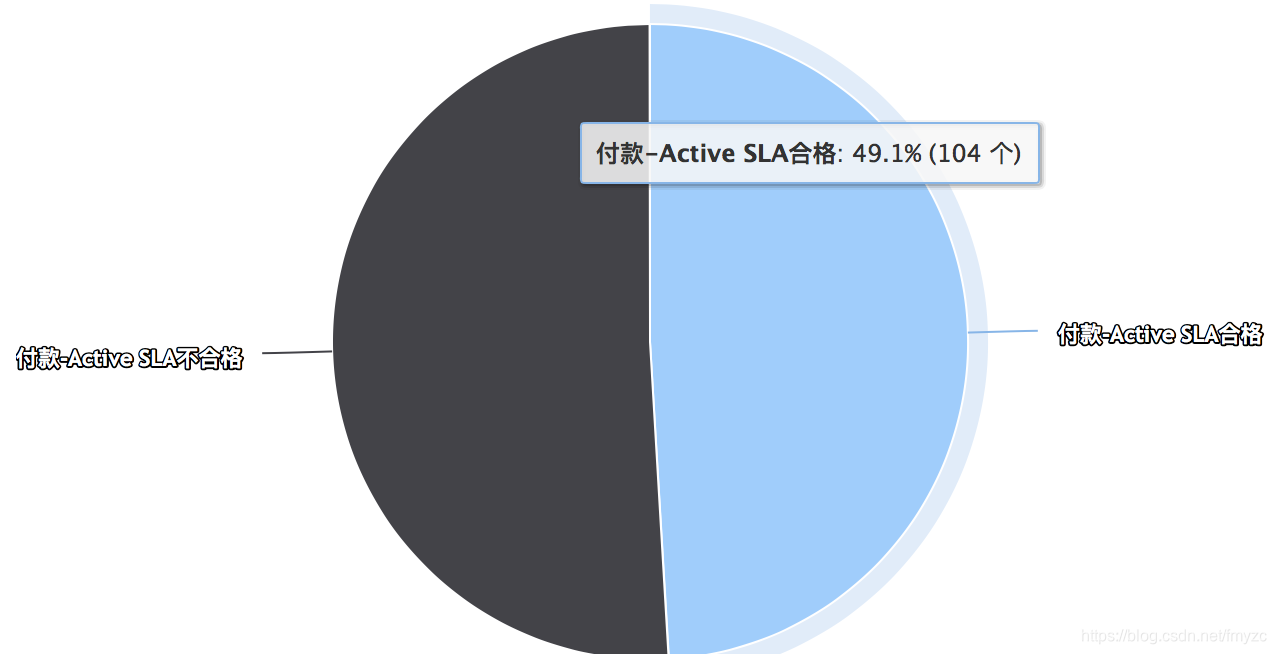
二.饼图
先上一张效果图
直接上代码
$('#container1').highcharts({
            chart: {
                renderTo: 'chart'
            },
            title: {
                text: '支付-Active 统计图'
            },
            plotArea: {
                shadow: null,
                borderWidth: null,
                backgroundColor: null
            },
            tooltip: {
                formatter: function() {   //重点在这个格式这里
                    return '<b>'+ this.point.name +'</b>: '+ Highcharts.numberFormat(this.percentage, 1) +'% ('+
                        Highcharts.numberFormat(this.y, 0, ',') +' 个)';
                }
            },
            plotOptions: {
                pie: {
                    allowPointSelect: true,
                    cursor: 'pointer',
                    dataLabels: {
                        enabled: true,
                        formatter: function() {
                            if (this.percentage > 4) return this.point.name;
                        },
                        color: 'white',
                        style: {
                            font: '13px Trebuchet MS, Verdana, sans-serif'
                        }
                    }
                }
            },
            legend: {
                backgroundColor: '#FFFFFF',
                x: 0,
                y: -30
            },
            credits: {
                enabled: false
            },
            series: [{
                type: 'pie',
                name: 'Browser share',
                data: [
                    ['付款-Active 合格',120],
                    ['付款-Active 不合格',130],//名称和数量
                ]
            }]

        });


 818
818


 到【灌水乐园】发言


