


 文章展示了如何使用Echarts进行动态折线图渲染,包括根据数据动态修改鼠标悬浮时的显示内容,处理不同数量的折线图系列,以及在多条折线中只显示一条但鼠标悬浮时显示所有信息。同时,文章提到了正常值和异常值的色彩区分方法以及多轴显示的配置技巧。
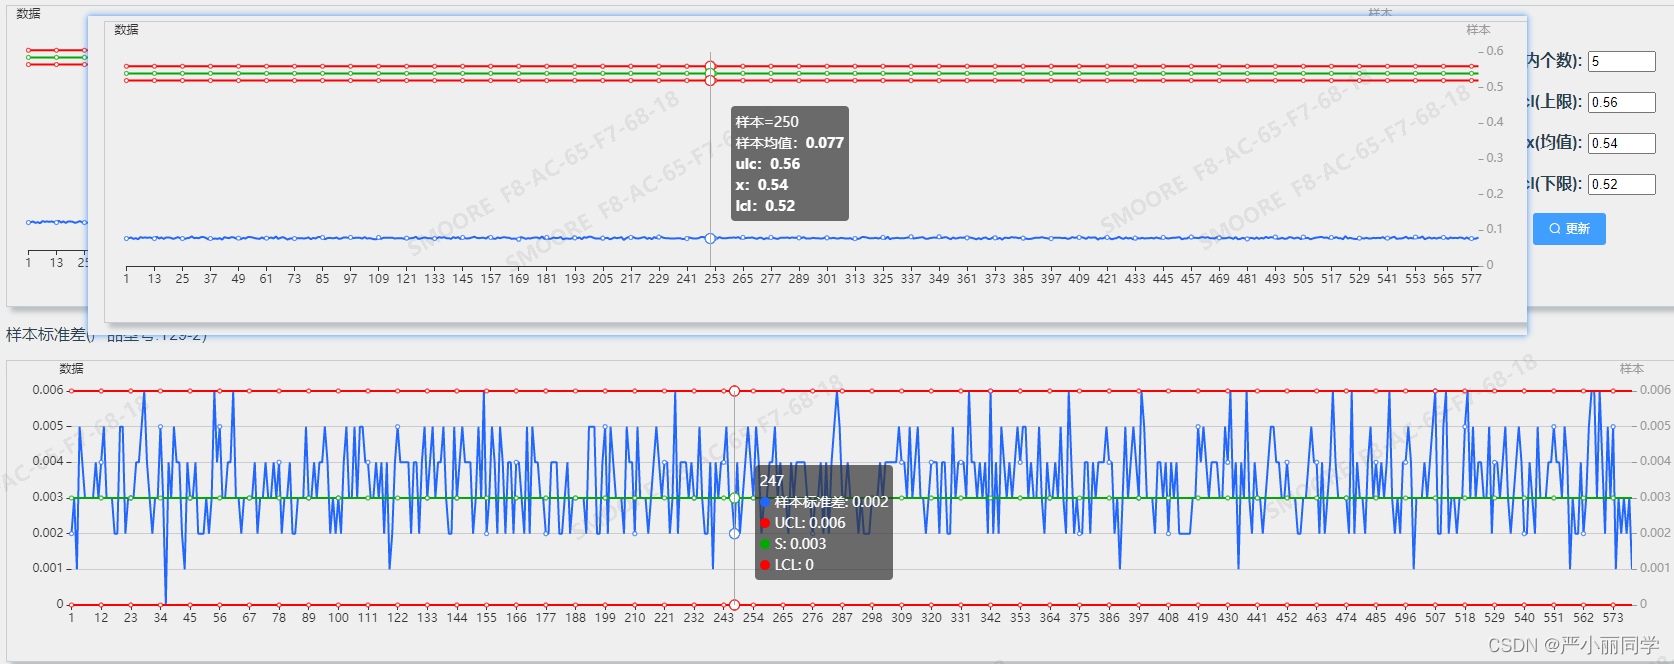
1.修改鼠标悬浮自定义名称数据结构
tooltip: {
		trigger: 'axis',
		// show: true,
		// // 自定义修改悬浮内容
		formatter: function(params) {
			var result = '';
			result += '样本=' + params[0].dataIndex
			params.forEach(function(item) {
				result += '<br/>';
				if (item.seriesIndex == 0) {
					result += '样本均值:' + '<b>' + item.value;
				}
				if (item.seriesIndex == 1) {
					result += 'ulc:' + '<b>' + item.value;
				}
				if (item.seriesIndex == 2) {
					result += 'x:' + '<b>' + item.value;
				}
				if (item.seriesIndex == 3) {
					result += 'lcl:' + '<b>' + item.value;
				}
			});
			return result;
		}

	},
2.把echarts里的series改成动态的(折线条数不确定情况下动态渲染n条)
let x_data = state.chartData.chartData.xValue
				let y_data = state.chartData.chartData.yValue
				let y_dataArr = []
				let obj = {}
				for (let i = 0; i < y_data.length; i++) {
					obj = {
						name: y_data[i].name,
						type: 'line',
						stack: 'Total',
						data: y_data[i].data
					}
					y_dataArr.push(obj)
				}

const init = (x_data, y_data) => {
		let chart = echarts.init(document.getElementById('charts'))
		let option = {
			tooltip: {
				trigger: 'axis',
				confine: true,
			},
			grid: {
				top: '10%',
				left: '1.5%',
				right: '1.5%',
				containLabel: true
			},

			calculable: true,
			xAxis: [{
				type: 'category',
				data: x_data
			}],
			yAxis: [{
				type: 'value',
				axisLine: {
					show: false,
				},
				axisTick: {
					show: false
				},

			}],
			series: y_data
			// series: [
			// 	{
			// 		name: 'Email',
			// 		type: 'line',
			// 		stack: 'Total',
			// 		data: y_data[0].data
			// 	},
			// 	{
			// 		name: 'Union Ads',
			// 		type: 'line',
			// 		stack: 'Total',
			// 		data: y_data[1].data
			// 	}

			// ]
		};

		chart.clear()
		chart.resize()
		chart.setOption(option)
	};
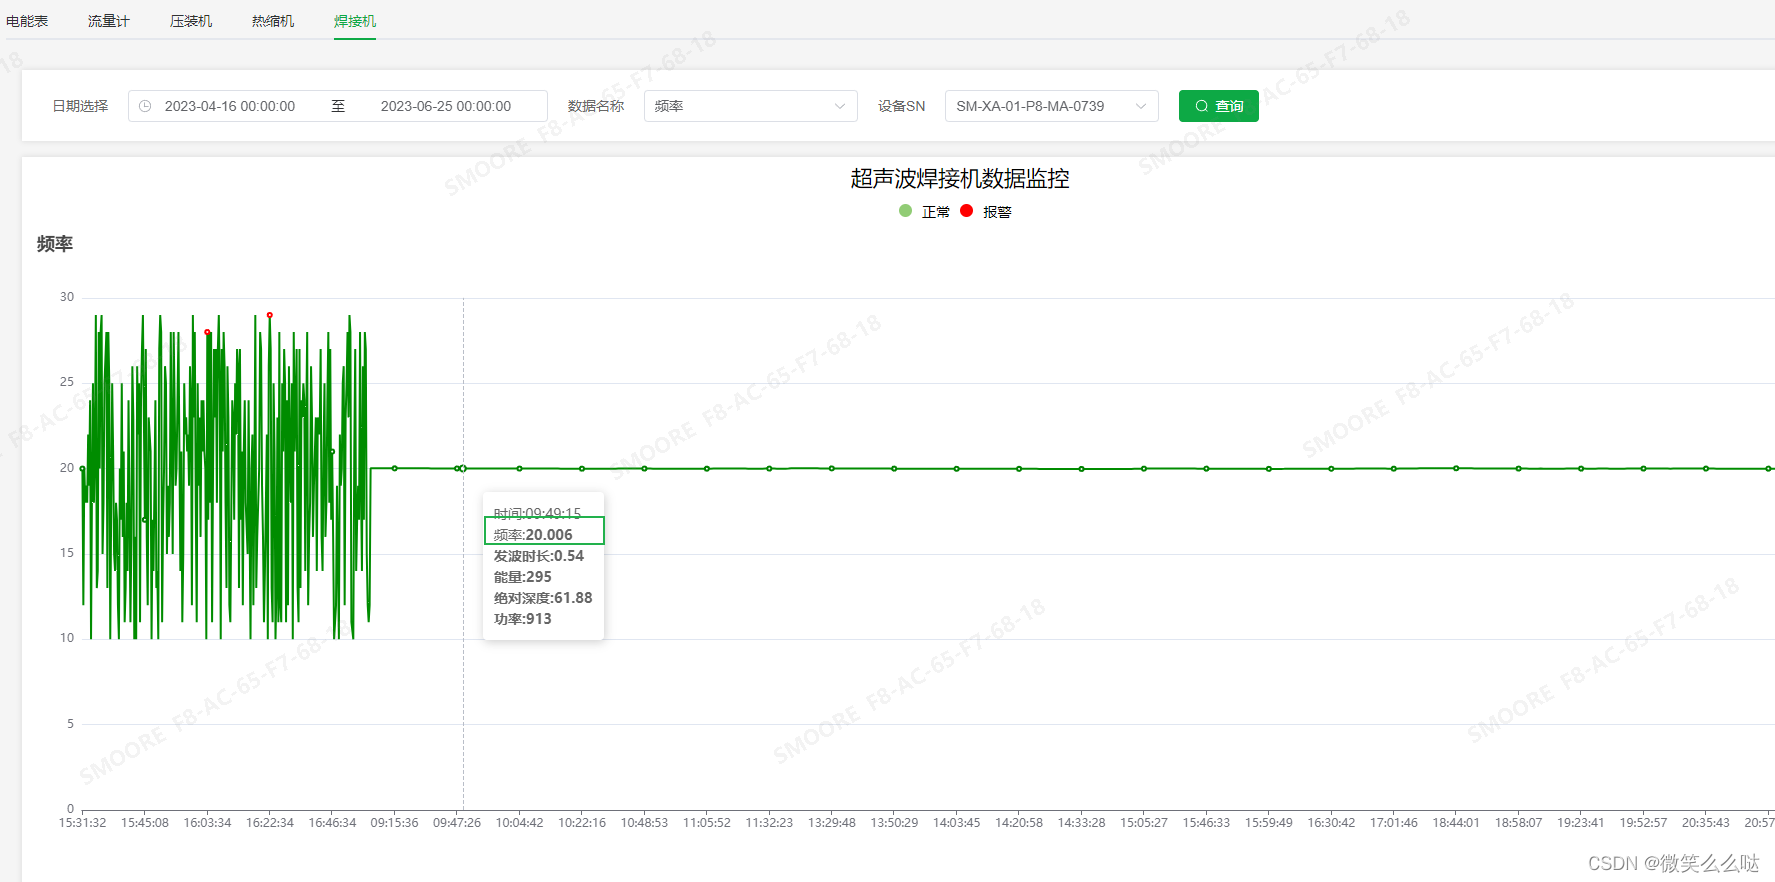
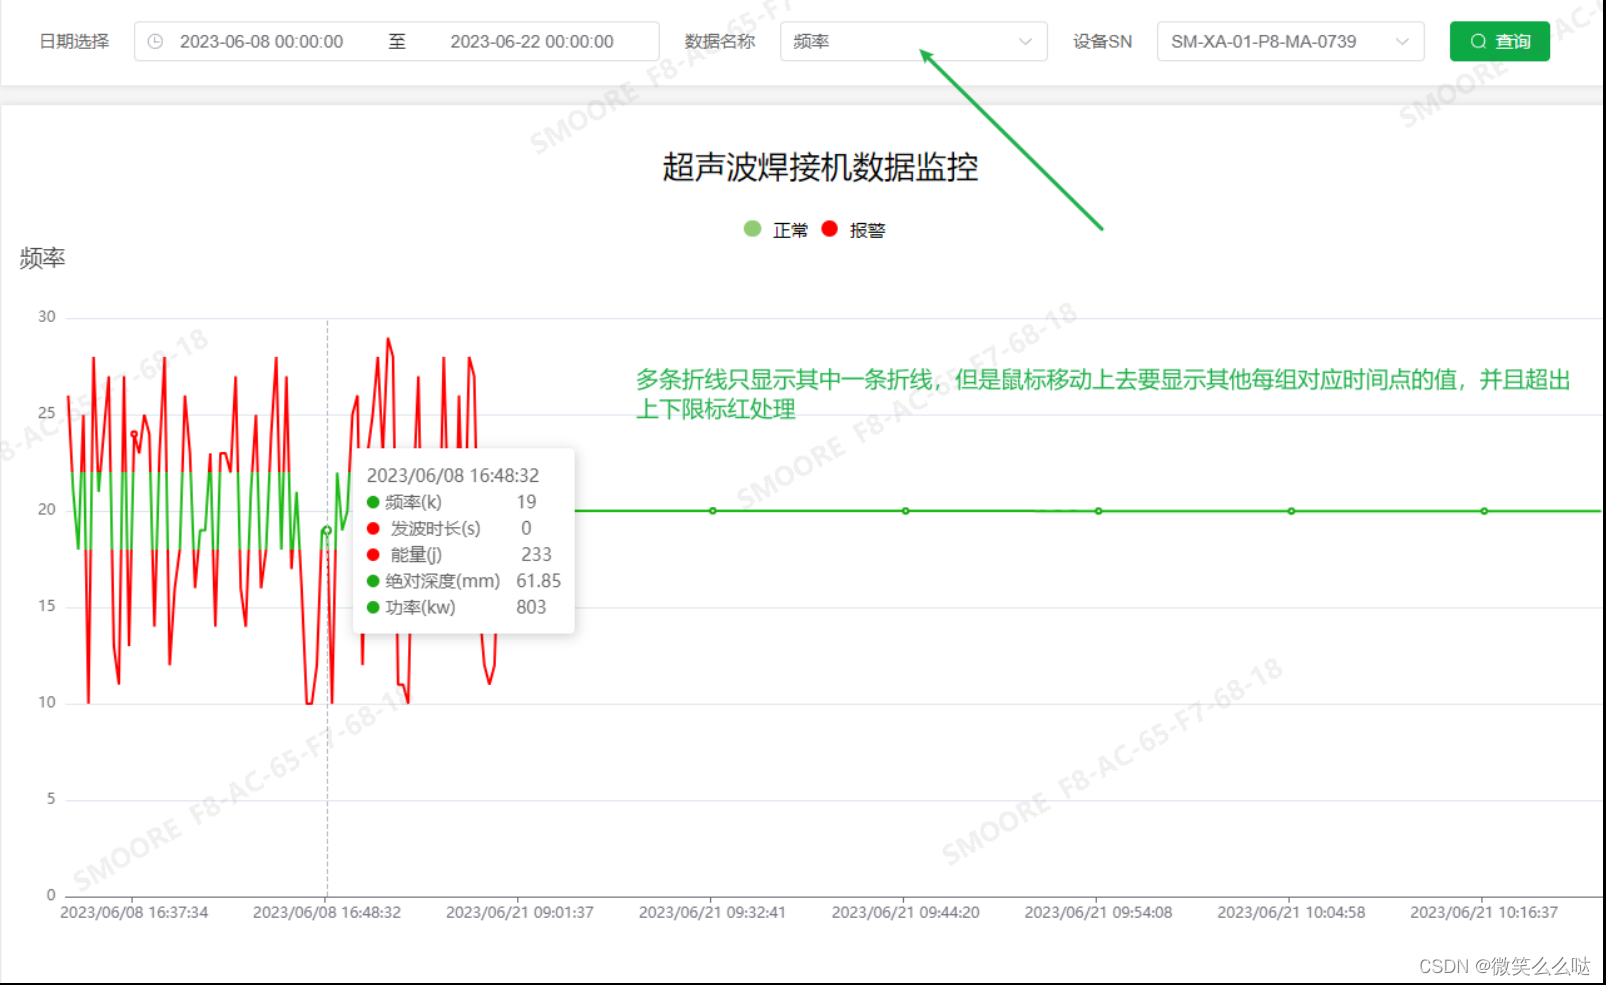
3.有多条线,但是只展示其中一条折线,鼠标移动却需要同时展示其他几条的信息
<div class="charts" id="charts5" v-resize='monResize'></div>
js:
const search = (id : string) => {//图表查询
let obj = {
"startDate": new Date(formatDate(state.condition.date[0],2)),// "2023-06-05", //开始日期
"endDate": new Date(formatDate(state.condition.date[1],2) + ' 00:00:00'),// "2023-06-09", //结束日期
"type": 5, //1电量,2用气量,3压力,4温度,5焊接机
"deviceSN": state.deviceSN, //设备SN type = 3 4 5 时必传
"dataType":state.dataType,// "频率", //type=5 必传
"queryGranularity": state.condition.queryGranularity //统计方式:1时,2日,3周,4月,5年,type=1时必传
}
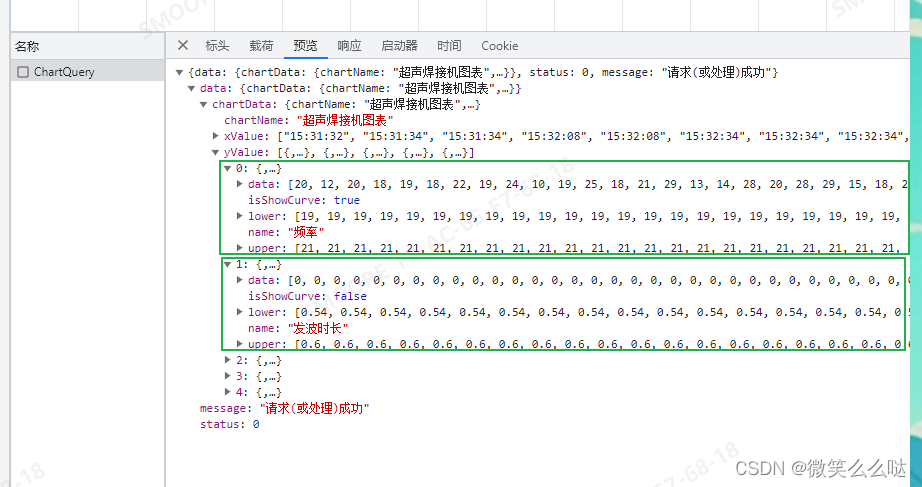
ChartQuery(obj).then((res : any) => {
if (res.status === 0) {
// ElMessage({ type: 'success', message: '操作成功' });
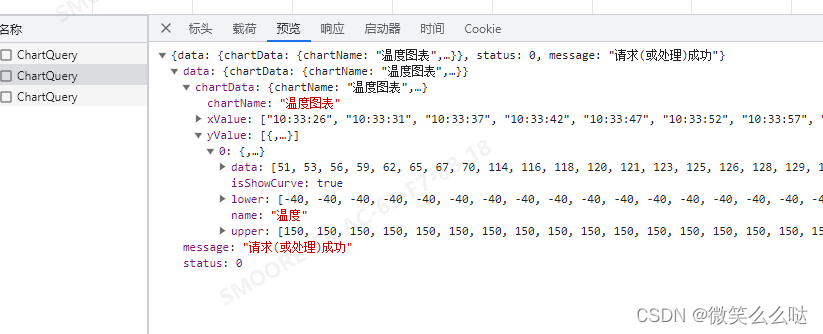
state.chartData = res.data;
// 处理折线图数据格式
let x_data = state.chartData.chartData.xValue
let y_data = state.chartData.chartData.yValue
let y_dataArr = []
let y_dataAll = []
let obj = {}
for (let i = 0; i < y_data.length; i++) {
let minRanger=y_data[0].lower[0];
let maxRanger=y_data[0].upper[0];
console.log(y_data[i].isShowCurve,77777)
if(y_data[i].isShowCurve==true){
obj = {
name: y_data[i].name,
type: 'line',
stack: 'Total',
data: y_data[i].data,
itemStyle: {
normal: {//这里必须加normal,否则不显示颜色变化
color: function (params) {//超过预警值显示红色
if (y_data[i].data[params.dataIndex] > maxRanger) {
return 'red';
} else {
return 'green';
}
},
lineStyle: {
color: 'green' //改变折线颜色
}
}
},
}
y_dataArr.push(obj)//折线图条数是动态单条渲染,series是动态的数组
y_dataAll.push(obj)//所有数据
// init(x_data, y_dataArr,y_dataAll)
// return
}else{
obj = {
name: y_data[i].name,
type: 'line',
stack: 'Total',
data: y_data[i].data,
}
// y_dataArr.push(obj)//折线图条数是动态渲染,series是动态的数组
y_dataAll.push(obj)//所有数据
}
}
console.log(y_dataArr,7777)
console.log(y_dataAll,777788888)
init(x_data, y_dataArr,y_dataAll)
}
});
};
const init = (x_data, y_data,y_dataAll2) => {
let y_dataAll=y_dataAll2;
// console.log(y_dataAll,777788888)
let chart = echarts.init(document.getElementById('charts5'))
let option = {
title: {
text: state.dataType
},
tooltip: {
trigger: 'axis',
// show: true,
// // 自定义修改悬浮内容
formatter: function(params) {
// console.log(y_dataAll,77778888899)
// console.log(params,777788888994444)
var result = '';
result += '时间:' + params[0].name
y_dataAll.forEach(function(item) {
console.log(item,11117777)
result += '<br/>';
result += item.name+':'+ '<b>' + item.data[params[0].dataIndex];
});
return result;
}
},
// legend:{selectedMode:'single'},
grid: {
top: '10%',
left: '1.5%',
right: '1.5%',
containLabel: true
},
dataZoom: {
type: 'inside', //放大缩小x轴数值
},
calculable: true,
xAxis: [{
type: 'category',
data: x_data
}],
yAxis: [{
type: 'value',
axisLine: {
show: false,
},
axisTick: {
show: false
},
}],
series: y_data
// series: [
// {
// name: 'Email',
// type: 'line',
// stack: 'Total',
// data: y_data[0].data
// },
// {
// name: 'Union Ads',
// type: 'line',
// stack: 'Total',
// data: y_data[1].data
// }
// ]
};
chart.clear()
chart.resize()
chart.setOption(option)
};
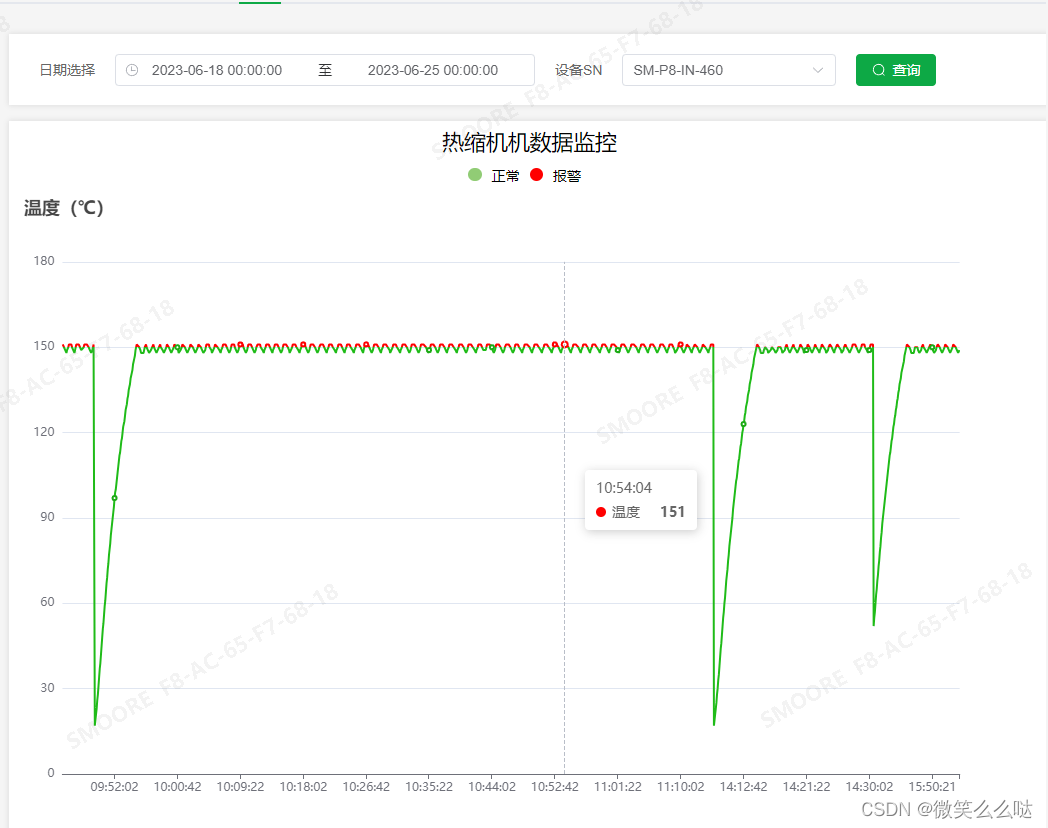
4:正常值折线绿色显示,异常值红色显示
html:			<div class="charts" id="charts4" v-resize='monResize'></div>
js:
方法1:在内部处理
	const search = (id : string) => {//图表查询
		let obj = {
			"startDate": new Date(formatDate(state.condition.date[0], 2)),// "2023-06-05", //开始日期
			"endDate": new Date(formatDate(state.condition.date[1], 2) + ' 00:00:00'),// "2023-06-09", //结束日期
			"type": 4, //1电量,2用气量,3压力,4温度,5焊接机
			"deviceSN": state.deviceSN, //设备SN type = 3 4 5 时必传
			"queryGranularity": state.condition.queryGranularity //统计方式:1时,2日,3周,4月,5年,type=1时必传
		}
		ChartQuery(obj).then((res : any) => {
			if (res.status === 0) {
				// ElMessage({ type: 'success', message: '操作成功' });
				state.chartData = res.data;
				// 处理折线图数据格式
				let x_data = state.chartData.chartData.xValue
				let y_data = state.chartData.chartData.yValue
				let y_dataArr = []
				let upperArr = []
				let lowerArr = []
				let obj = {}
				let upper = {}
				let lower = {}
				let minRanger = 0;
				let maxRanger = 0;
				for (let i = 0; i < y_data.length; i++) {
					minRanger = y_data[0].lower[0];
					maxRanger = y_data[0].upper[0];
					obj = {
						name: y_data[i].name,
						type: 'line',
						stack: 'Total',
						data: y_data[i].data,
					}
					upper = {
						name: "上限",
						type: 'line',
						stack: 'Total',
						data: y_data[i].upper
					}
					lower = {
						name: "下限",
						type: 'line',
						stack: 'Total',
						data: y_data[i].lower
					}
					y_dataArr.push(obj)//折线图条数是动态渲染,series是动态的数组
				}
				init(x_data, y_dataArr, minRanger, maxRanger)
			}
		});
	};

	const init = (x_data, y_data, minRanger, maxRanger) => {
		let chart = echarts.init(document.getElementById('charts4'))
		let option = {
			title: {
				text: '温度(℃)'
			},
			tooltip: {
				trigger: 'axis',
				confine: true,
			},
			grid: {
				top: '10%',
				left: '1.5%',
				right: '1.5%',
				containLabel: true
			},
			dataZoom: {
				type: 'inside', //放大缩小x轴数值
			},
			calculable: true,
			xAxis: [{
				type: 'category',
				data: x_data
			}],
			yAxis: [{
				type: 'value',
				axisLine: {
					show: false,
				},
				axisTick: {
					show: false
				},

			}],
			series: y_data,
			// series: [
			// 	{
			// 		name: 'Email',
			// 		type: 'line',
			// 		stack: 'Total',
			// 		data: y_data[0].data
			// 	},
			// 	{
			// 		name: 'Union Ads',
			// 		type: 'line',
			// 		stack: 'Total',
			// 		data: y_data[1].data
			// 	}

			// ]
			visualMap: {
				precision: 10, //小数精度
				show: false,//标签是否显示
				pieces: [
					//小于最小值-红色
					{
						// lte:this.minRanger, //小于等于最小值
						lt: minRanger, //小于最小值(具体数值,按实际需求填写)
						color: "red"
					},
					//最小和最大值之间-蓝色
					{
						// gt:this.minRanger, //大于最小值
						gte: minRanger, //大于等于最小值(具体数值,按实际需求填写)
						lte: maxRanger, //小于等于最大值(具体数值,按实际需求填写)
						color: "#1daa16"
					},
					//大于最大值-红色
					{
						gt: maxRanger, //大于最大值(具体数值,按实际需求填写)
						color: "red"
					},
				],
			},

		};
		chart.clear()
		chart.resize()
		chart.setOption(option, true)
	};
方法2:在外部处理
	const search = (id : string) => {//图表查询
		let obj = {
			"startDate": formatDate(state.condition.date[0], 3),// "2023-06-05", //开始日期
			"endDate": formatDate(state.condition.date[1], 3),// "2023-06-09", //结束日期
			"type": 3, //1电量,2用气量,3压力,4温度,5焊接机
			"positions": JSON.stringify(state.condition.positions),
			"deviceSN": state.deviceSN, //设备SN type = 3 4 5 时必传
			"queryGranularity": state.condition.queryGranularity //统计方式:1时,2日,3周,4月,5年,type=1时必传
		}

		ChartQuery(obj).then((res : any) => {
			if (res.status === 0) {
				// ElMessage({ type: 'success', message: '操作成功' });
				state.chartData = res.data;
				// 处理折线图数据格式
				let x_data = state.chartData.chartData.xValue
				let y_data = state.chartData.chartData.yValue
				let y_dataArr = []
				let obj = {}
				for (let i = 0; i < y_data.length; i++) {
					let minRanger = y_data[0].lower[0];
					let maxRanger = y_data[0].upper[0];
					obj = {
						name: y_data[i].name,
						type: 'line',
						stack: 'Total',
						data: y_data[i].data,
						itemStyle: {
							normal: {//这里必须加normal,否者不显示夜色变化
								color: function (params) {//超过预警值显示红色
									if (y_data[i].data[params.dataIndex] > maxRanger) {
										return 'red';
									} else {
										// return '#91cc75';
									}
								},
								lineStyle: {
									// color: '#91cc75' //改变折线颜色
								}
							}
						},
					}
					y_dataArr.push(obj)//折线图条数是动态渲染,series是动态的数组
				}
				// console.log(y_dataArr,7777)
				init(x_data, y_dataArr)
			}
		});
	};

	const init = (x_data, y_data) => {
		let chart = echarts.init(document.getElementById('charts3'))
		let option = {
			title: {
				text: '压力(N)'
			},
			tooltip: {
				trigger: 'axis',
				confine: true,
			},
			grid: {
				top: '10%',
				left: '1.5%',
				right: '1.5%',
				containLabel: true
			},
			dataZoom: {
				type: 'inside', //放大缩小x轴数值
			},
			calculable: true,
			xAxis: [{
				type: 'category',
				data: x_data
			}],
			yAxis: [{
				type: 'value',
				axisLine: {
					show: false,
				},
				axisTick: {
					show: false
				},

			}],
			series: y_data
		};

		chart.clear()
		chart.resize()
		chart.setOption(option)
	};
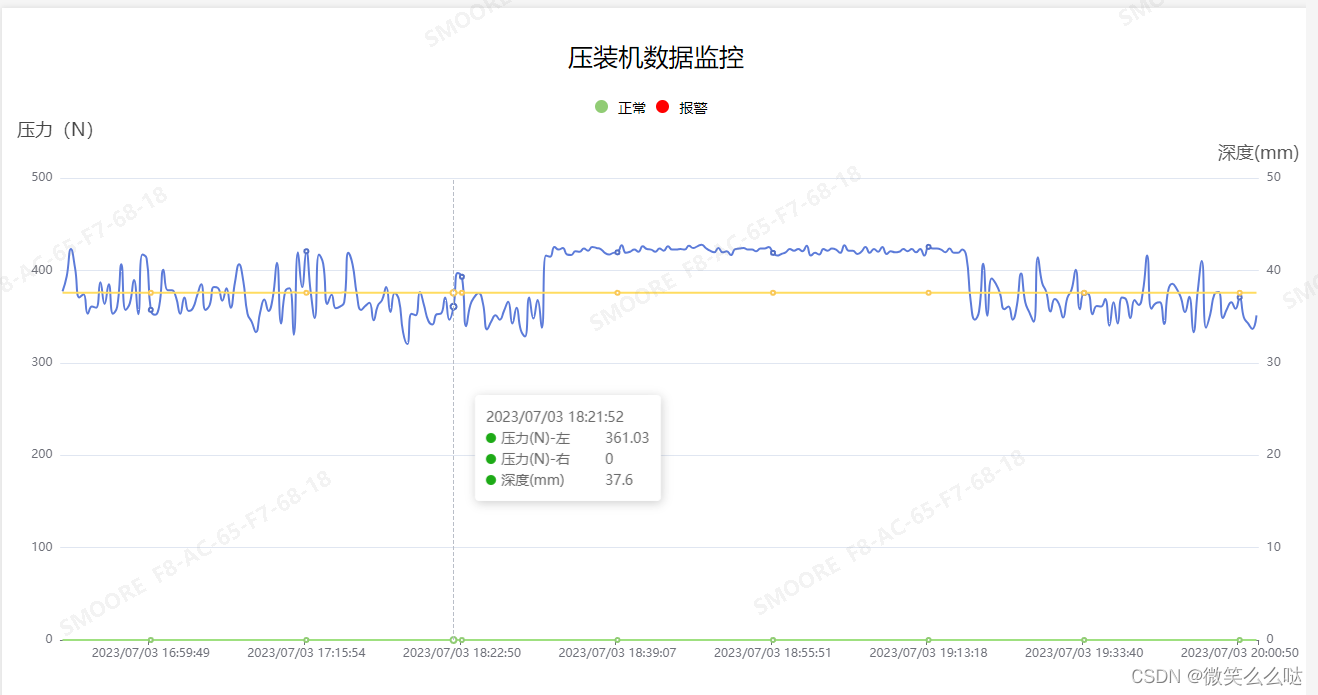
5.多条折线只显示其中一条折线,但是鼠标移动上去要显示其他每组对应时间点的值,并且超出
上下限标红处理,并且自定义圆点给出颜色
tooltip: {
				trigger: 'axis',
				// show: true,
				// // 自定义修改悬浮内容
				/* formatter: function(params) {
					var result = '';
					result += params[0].name
					y_dataAll.forEach(function(item) {
						result += '<br/>';
						result += item.name+':'+  '<b>' + item.data[params[0].dataIndex];
					});
					return result;
				}, */
				formatter: function (params) {
					// console.log(params,77777)
					var result = '';
					result += params[0].name
					let data = params[0].data;
					let circle = `<span style="display:inline-block;margin-right:5px;border-radius:50%;width:10px;height:10px;left:15px;background-color:`;
					y_dataAll.forEach(function (item, index) {
						result += '<br/>';
						let n = 0;
						for (let i = 0; i < item.data.length; i++) {//获取当前选中节点的n坐标值
							if (item.data[i] == data) {
								n = i
							}
						}
						//判定每组超出上下限标红显示
						if (item.data[n] > item.maxRanger || item.data[n] < item.minRanger) {
							result += `${circle}red"></span> <span style="width:100px;display:inline-block;">${item.name
								}</span> ${item.data[params[0].dataIndex]}`
						} else {
							result += `${circle}#1daa16"></span><span style="width:100px;display:inline-block;m"> ${item.name
								}</span>  ${item.data[params[0].dataIndex]}`
						}

					});
					return result;
				},
			},
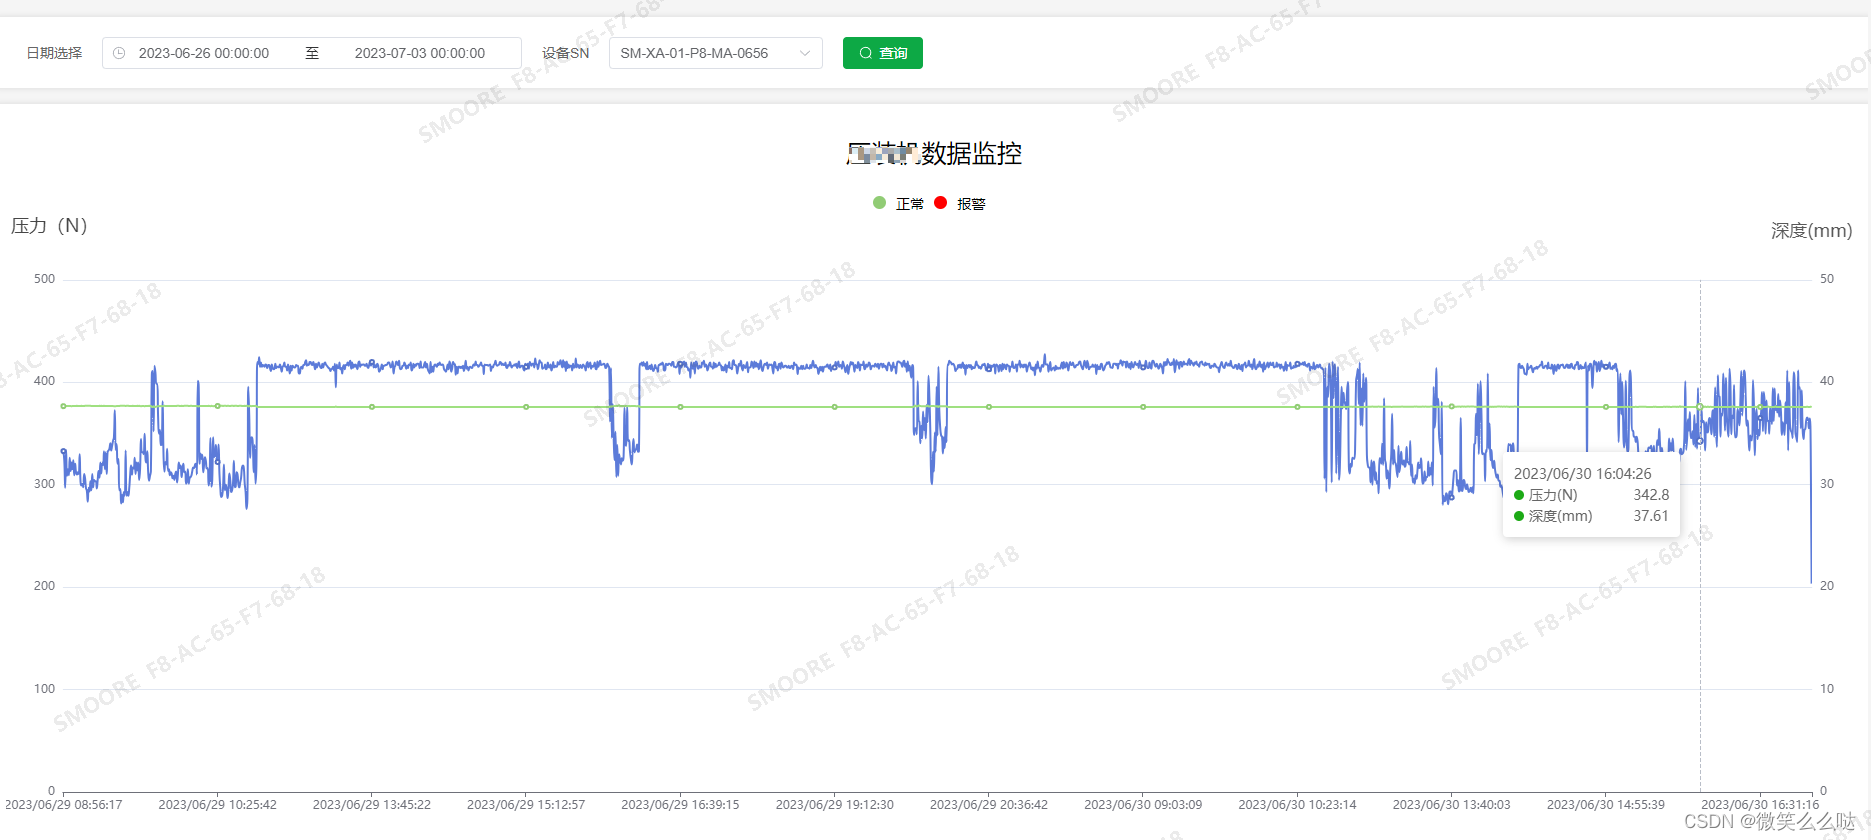
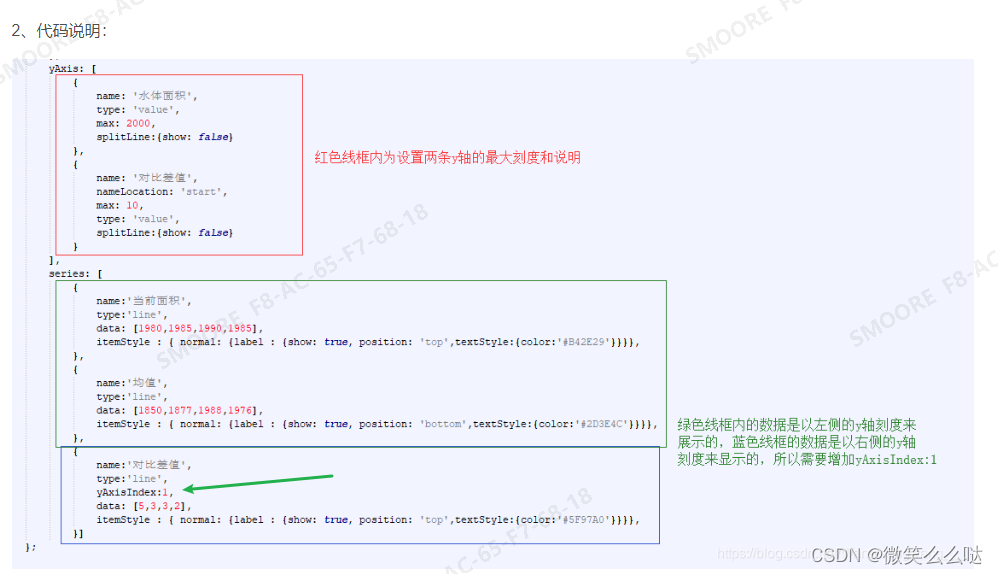
6.关于Y轴刻度相关配置(主看yAxis相关配置)
const search = (id : string) => {//图表查询
		let obj = {
			"startDate": formatDate(state.condition.date[0], 3),// "2023-06-05", //开始日期
			"endDate": formatDate(state.condition.date[1], 3),// "2023-06-09", //结束日期
			"type": 3, //1电量,2用气量,3压力,4温度,5焊接机
			"positions": JSON.stringify(state.condition.positions),
			"deviceSN": state.deviceSN, //设备SN type = 3 4 5 时必传
			"queryGranularity": state.condition.queryGranularity //统计方式:1时,2日,3周,4月,5年,type=1时必传
		}

		ChartQuery(obj).then((res : any) => {
			if (res.status === 0) {
				// ElMessage({ type: 'success', message: '操作成功' });
				state.chartData = res.data;
				// 处理折线图数据格式
				let x_data = state.chartData.chartData.xValue
				let y_data = state.chartData.chartData.yValue
				let y_dataArr = []
				let obj = {}
				let minRanger = 0;
				let maxRanger = 0;
				let yAxisIndex=0;
				for (let i = 0; i < y_data.length; i++) {
					minRanger = y_data[0].lower[0];
					maxRanger = y_data[0].upper[0];
					obj = {
						name: y_data[i].name,
						type: 'line',
						data: y_data[i].data,
						yAxisIndex: i,
						minRanger: y_data[i].lower[0],
						maxRanger: y_data[i].upper[0],
						smooth: true
					}
					y_dataArr.push(obj)//折线图条数是动态渲染,series是动态的数组
				}
				console.log(y_dataArr,7777)
				init(x_data, y_dataArr, minRanger, maxRanger)
			}
		});
	};
	const init = (x_data, y_data, minRanger, maxRanger) => {
		// console.log(minRanger, maxRanger, 7777)
		let chart = echarts.init(document.getElementById('charts3'))
		let option = {
			title: {
				text: '压力(N)',
				textStyle: {
					fontWeight: '400'
				}
			},
			tooltip: {
				trigger: 'axis',
				confine: true,
				formatter: function (params) {
					// console.log(params,77777)
					var result = '';
					result += params[0].name
					let data = params[0].data;
					let circle = `<span style="display:inline-block;margin-right:5px;border-radius:50%;width:10px;height:10px;left:15px;background-color:`;
					y_data.forEach(function (item, index) {
						result += '<br/>';
						let n = 0;
						for (let i = 0; i < item.data.length; i++) {//获取当前选中节点的n坐标值
							if (item.data[i] == data) {
								n = i
							}
						}
						//判定每组超出上下限标红显示
						if (item.data[n] > item.maxRanger || item.data[n] < item.minRanger) {
							result += `${circle}red"></span> <span style="width:100px;display:inline-block;">${item.name
								}</span> ${item.data[params[0].dataIndex]}`
						} else {
							result += `${circle}#1daa16"></span><span style="width:100px;display:inline-block;m"> ${item.name
								}</span>  ${item.data[params[0].dataIndex]}`
						}

					});
					return result;
				},
			},
			grid: {
				top: '10%',
				left: '1.5%',
				right: '1.5%',
				containLabel: true
			},
			dataZoom: {
				type: 'inside', //放大缩小x轴数值
			},
			calculable: true,
			xAxis: [{
				type: 'category',
				data: x_data
			}],
			yAxis: [{
				type: 'value',
			},
			{
				name: '深度(mm)',
				// nameLocation: 'start',
				alignTicks: true,
				nameGap: '39',//y 轴单位标题与图表之间的距离
				nameTextStyle :{
									fontSize: 18,
									 color:'#585858'

								},
			}
			],
			series: y_data,

		};

		chart.clear()
		chart.resize()
		chart.setOption(option)
	};
7.echarts 三种数据双y轴显示,多条折线展示2组单位


 120
120


 到【灌水乐园】发言


