


 本文介绍了HystrixDashboard和HystrixTurbine在微服务架构中的作用,用于监控服务的健康状态和断路器效果。通过引入相关依赖并配置,展示了如何在Spring Boot应用中启用HystrixDashboard和Turbine,实现实时监控服务调用的状态,并聚合多个服务的监控数据。文章还详细解释了HystrixDashboard和Turbine仪表盘的界面元素及含义。
一、Hystrix Dashboard简介
在微服务架构中为例保证程序的可用性,防止程序出错导致网络阻塞,出现了断路器模型。断路器的状况反应了一个程序的可用性和健壮性,它是一个重要指标。Hystrix Dashboard是作为断路器状态的一个组件,提供了数据监控和友好的图形化界面。
Hystrix仪表盘:它主要用来实时监控Hystrix的各项指标信息。通过Hystrix Dashboard反馈的实时信息,可以帮助我们快速发现系统中存在的问题,从而及时地采取应对措施。
Hystrix(注意 是单纯的Hystrix) 提供了对于微服务调用状态的监控(信息), 但是,需要结合 spring-boot-actuator 模块一起使用。
二、实战
2.1 改造user服务:
在pom中引入:
       <dependency>
            <groupId>org.springframework.cloud</groupId>
            <artifactId>spring-cloud-starter-netflix-hystrix</artifactId>
        </dependency>

         <dependency>
            <groupId>org.springframework.boot</groupId>
            <artifactId>spring-boot-starter-actuator</artifactId>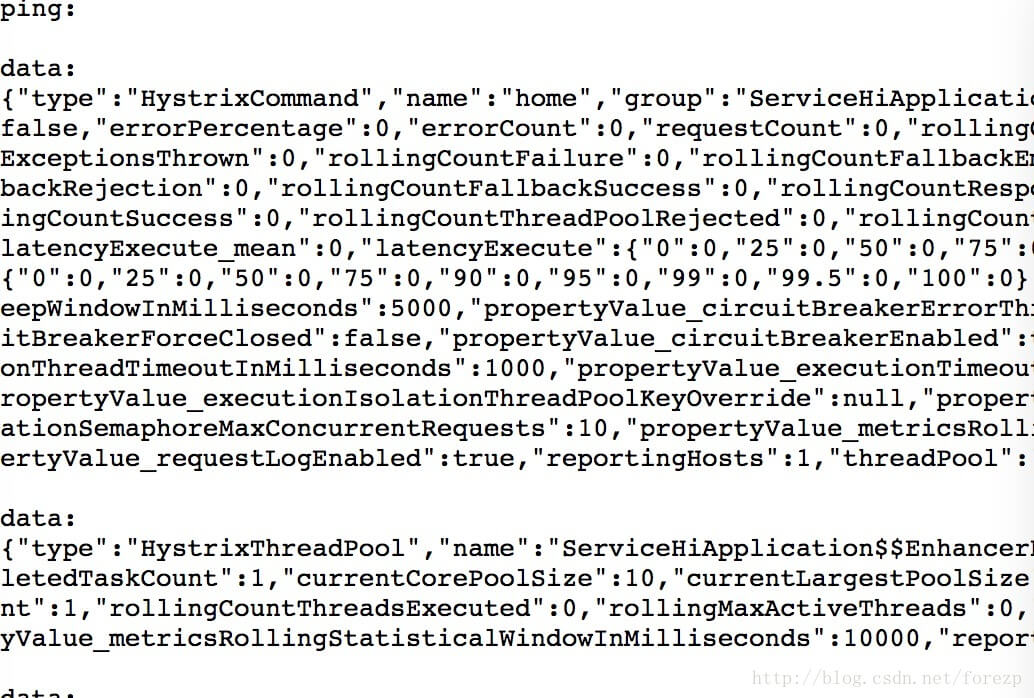
</dependency>这时候访问/actuator/hystrix.stream 便可以看见微服务调用的状态信息。
(需要注意的是, 在Spring Finchley 版本以前访问路径是/hystrix.stream,如果是Finchley 的话 还得在yml里面 加入配置:
management:
  endpoints:
    web:
      exposure:
        include: '*'
因为spring Boot 2.0.x以后的Actuator 只暴露了info 和health 2个端点,这里我们把所有端点开放。 )
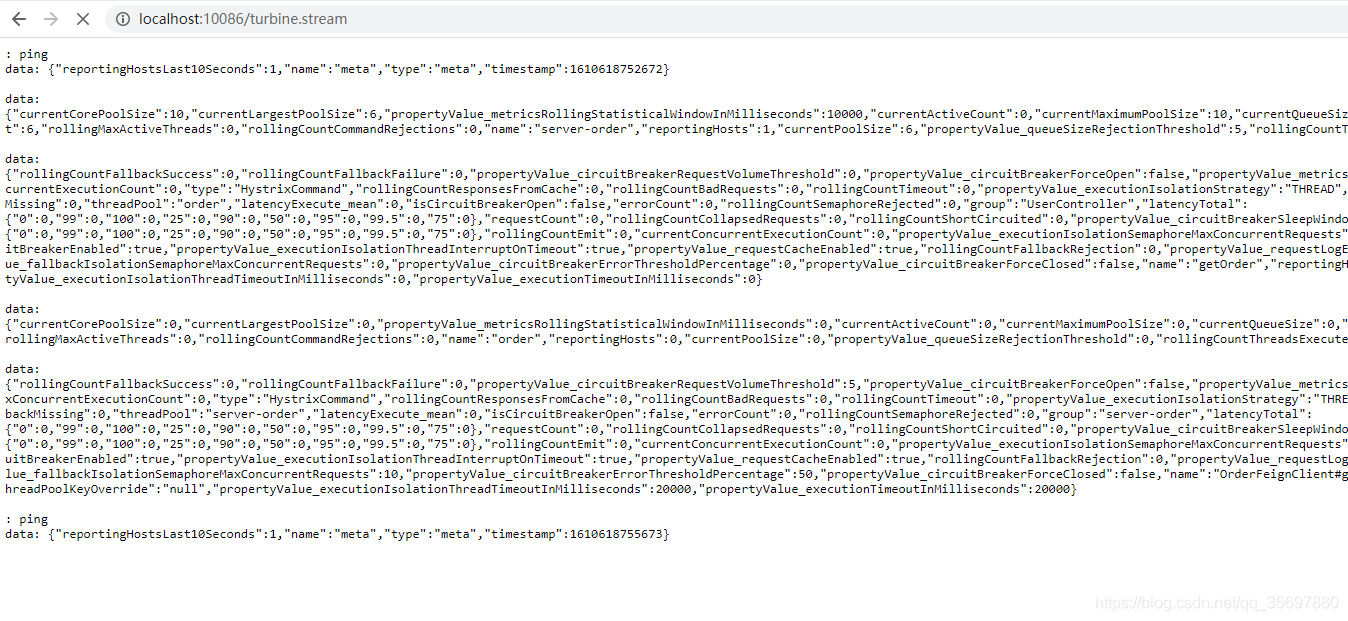
启动user服务:查看 http://localhost:5000/actuator/hystrix.stream 可以看到一些具体的数据:
2.2、创建hystrix-dashboard服务
我们新建一个项目 加入依赖:
  <dependency>
            <groupId>org.springframework.cloud</groupId>
            <artifactId>spring-cloud-starter-netflix-hystrix-dashboard</artifactId>
        </dependency>
在spring boot启动类上面加入注解EnableHystrixDashboard
package com.dukun.study.dashboard;

import org.springframework.boot.SpringApplication;
import org.springframework.boot.autoconfigure.SpringBootApplication;
import org.springframework.cloud.netflix.eureka.EnableEurekaClient;
import org.springframework.cloud.netflix.hystrix.dashboard.EnableHystrixDashboard;
import org.springframework.cloud.netflix.turbine.EnableTurbine;

/**
 * HystrixDashboard 启动类
 *
 * @Author: dukun0210
 * @Date: 2021/1/14 11:39
 */
@EnableEurekaClient
@EnableTurbine
@EnableHystrixDashboard
@SpringBootApplication
public class AppHystrixDashboard {

    public static void main(String[] args) {
        SpringApplication.run(AppHystrixDashboard.class);
    }
}
配置yml文件:
server:
  port: 10086

spring:
  application:
    name: service-turbine

eureka:
  client:
    serviceUrl:
      defaultZone: http://localhost:3000/eureka/
management:
  endpoints:
    web:
      exposure:
        include: "*"
      cors:
        allowed-origins: "*"
        allowed-methods: "*"
启动项目后访问/hystrix能看见一个类似tomcat的首页:
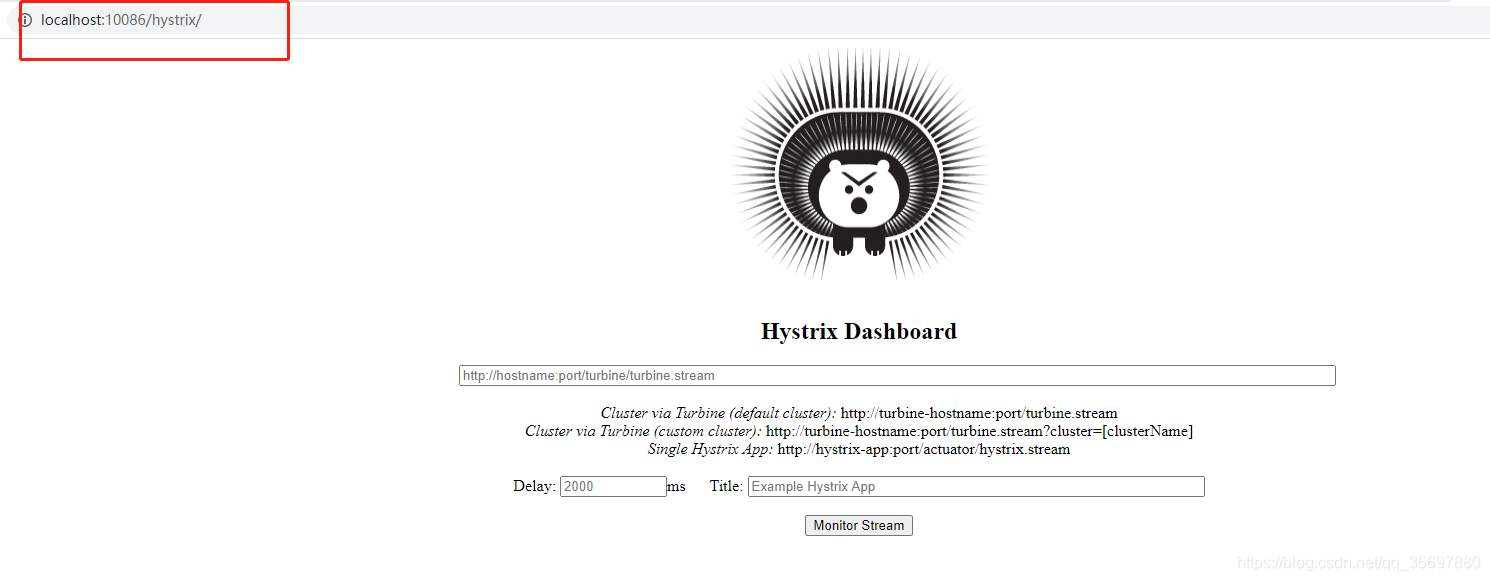
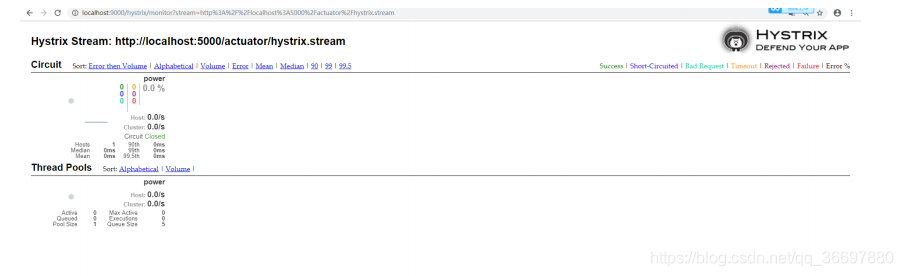
在中间这个输入框中,填入需要监控的微服务的监控地址 也就是/actuator/hystrix.stream点击按钮,就会跳转到 仪表盘页面:
2.3、Hystrix仪表盘解释
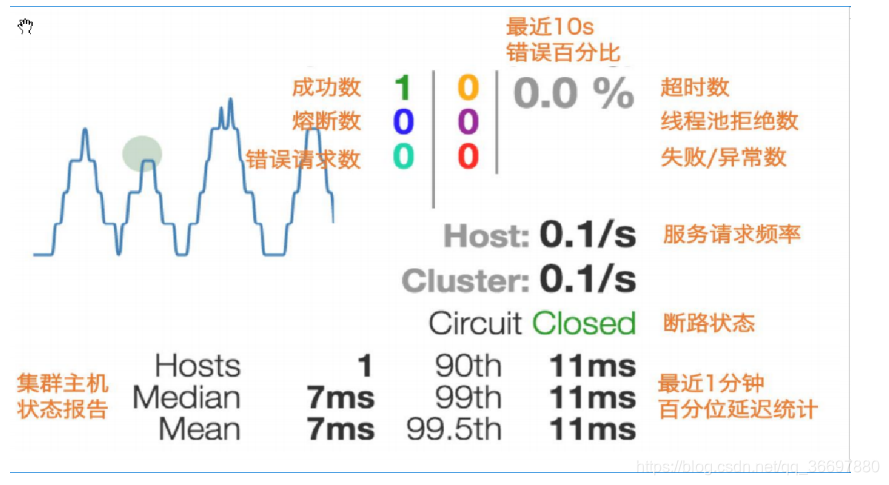
- 实心圆:共有两种含义。它通过颜色的变化代表了实例的健康程度,它的健康度从绿色 该实心圆除了颜色的变化之外,它的大小也会根据实例的请求流量发生变化,流量越大该实心圆就越大。所以通过 该实心圆的展示,就可以在大量的实例中快速的发现故障实例和高压力实例。
- 曲线:用来记录2分钟内流量的相对变化,可以通过它来观察到流量的上升和下降趋势。
整图解释:
三、Hystrix Turbine
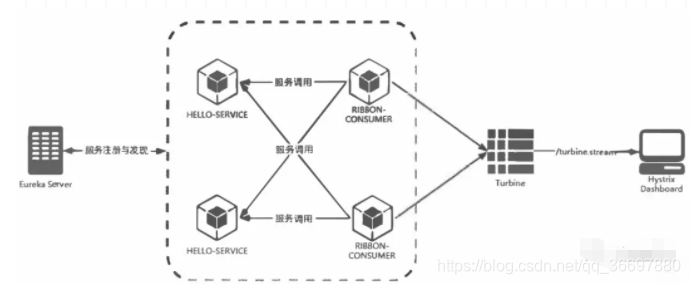
看单个的Hystrix Dashboard的数据并没有什么多大的价值,要想看这个系统的Hystrix Dashboard数据就需要用到Hystrix Turbine。Hystrix Turbine将每个服务Hystrix Dashboard数据进行了整合。Hystrix Turbine的使用非常简单,只需要引入相应的依赖和加上注解和配置就可以了。
3.1.1、改造hystrix-dashboard服务
加入依赖:
  <dependency>
            <groupId>org.springframework.cloud</groupId>
            <artifactId>spring-cloud-starter-netflix-turbine</artifactId>
        </dependency>
在其入口类ServiceTurbineApplication加上注解@EnableTurbine,开启turbine
/**
 * HystrixDashboard 启动类
 *
 * @Author: dukun0210
 * @Date: 2021/1/14 11:39
 */
@EnableEurekaClient
@EnableTurbine
@EnableHystrixDashboard
@SpringBootApplication
public class AppHystrixDashboard {

    public static void main(String[] args) {
        SpringApplication.run(AppHystrixDashboard.class);
    }
}
配置文件application.yml:
server:
  port: 10086

spring:
  application:
    name: service-turbine

eureka:
  client:
    serviceUrl:
      defaultZone: http://localhost:3000/eureka/
management:
  endpoints:
    web:
      exposure:
        include: "*"
      cors:
        allowed-origins: "*"
        allowed-methods: "*"

turbine:
  app-config: server-order,server-power,client-user
  aggregator:
    clusterConfig: default
  clusterNameExpression: new String("default")
  combine-host: true
  instanceUrlSuffix:
    default: actuator/hystrix.stream
3.2、Turbine演示
打开浏览器输入:http://localhost:10086/turbine.stream,界面如下:
打开:http://localhost:10086/hystrix/,输入监控流http://localhost:10086/turbine.stream
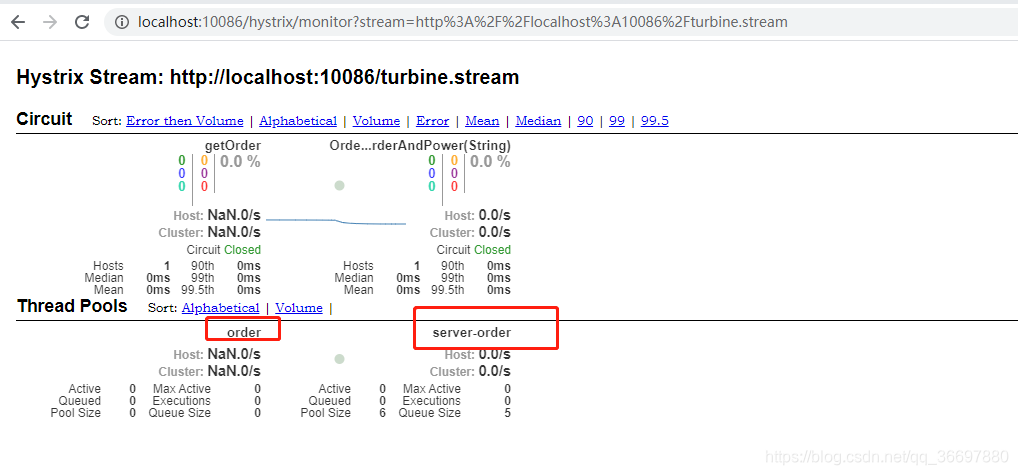
可以看到这个页面聚合了2个service的hystrix dashbord数据。
器架构图:


 174
174

 被折叠的 条评论
为什么被折叠?
被折叠的 条评论
为什么被折叠?
 到【灌水乐园】发言


