


 本文介绍了机器学习中的决策树模型,包括其基本原理和工作流程。通过一个简单的例子展示了如何使用决策树进行房价预测,以及如何改进模型以提高预测准确性。
1.How ModelsWork 模型是怎么工作的
本文是Kaggle自助学习下的文章,转回到目录点击这里
Notebook 笔记
This is the firststep in Kaggle's Learn Machine Learning series. 这是Kaggle的LearnMachine Learning系列的第一章。
Introduction 介绍
We'llstart with an overview of how machine learning models work and how they areused. This may feel basic if you've done statistical modeling or machinelearning before. Don't worry, we will progress to building powerful modelssoon.我们将首先概述机器学习模型如何工作以及如何使用它们。如果你之前已经完成了统计建模或机器学习,这可能会感觉基础。别担心,我们会尽快建立强大的模型。
Thecourse will have you build models for the following scenario:本课程将为你构建以下场景的模型:
Yourcousin has made millions of dollars speculating on real estate. He's offered tobecome business partners with you because of your interest in data science.He'll supply the money, and you'll supply models that predict how much varioushouses are worth.你的表弟已经让数百万美元的房地产投机。由于你对数据科学感兴趣,他被邀请成为你的商业伙伴。他会提供这笔钱,你会提供预测各种房屋价值的模型。
You askyour cousin how he's predicted real estate values in the past. and he says itis just intuition. But more questioning reveals that he's identified pricepatterns from houses he has seen in the past, and he uses those patterns tomake predictions for new houses he is considering.你问你的表哥他过去是如何预测房地产价值的。他说just直觉。但更多的调查表明,他发现了他过去看过的房屋的价格模式,并且使用这些模式来预测他正在考虑的新房子。
Machinelearning works the same way. We'll start with a model called the Decision Tree.There are fancier models that give more accurate predictions. But decisiontrees are easy to understand, and they are the basic building block for some ofthe best models in data science.机器学习以同样的方式工作。我们将从一个名为决策树的模型开始。有更加精确的预测模型。但决策树很容易理解,它们是数据科学中一些最佳模型的基本构建块。
Forsimplicity, we'll start with the simplest possible decision tree.为了简单起见,我们将从最简单的可能决策树开始。
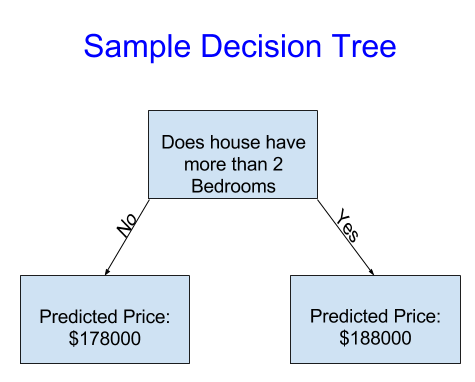
Itdivides houses into only two categories. You predict the price of a new houseby finding out which category it's in, and the prediction is the historicalaverage price from that category.它将房屋分为两类。你通过确定新房的价格来预测新房的价格,预测是该类别的历史平均价格。
Thiscaptures the relationship between house size and price. We use data to decidehow to break the houses into two groups, and then again to determine thepredicted price in each group. This step of capturing patterns from data iscalled fitting or training the model. The data used to fit the model is calledthe training data.这抓住了房屋大小和价格之间的关系。我们使用数据来决定如何将房屋分成两组,然后再确定每组的预测价格。从数据捕获如何分的模式的这一步称为拟合或训练模型。用于拟合模型的数据称为训练数据。
Thedetails of how the model is fit (e.g. how to split up the data) is complexenough that we will save it for later. After the model has been fit, you canapply it to new data to predict prices of additional homes.模型如何适合的详细信息(例如,如何分割数据)非常复杂,以至于我们稍后会保存它。在模型适用后,你可以将其应用于新数据以预测其他住宅的价格。
Example 例:
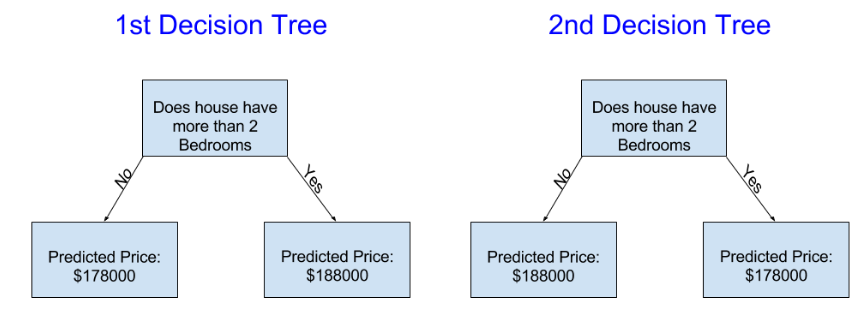
Assuming yourdecision tree works in a sensible way, which of the two trees shown here do youthink you might get from fitting this especially simple decision tree?假设你的决策树以合理的方式工作,那么你认为你可能从拟合这个特别简单的决策树中得到哪棵树?
Improving the Decision Tree 改进决策树
Thedecision tree on the left (Decision Tree 1) probably makes more sense, becauseit captures the reality that houses with more bedrooms tend to sell at higherprices than houses with fewer bedrooms. The biggest shortcoming of this modelis that it doesn't capture most factors affecting home price, like number ofbathrooms, lot size, location, etc.左边的决策树(决策树1)可能更有意义,因为它捕捉到更多卧室的房屋倾销价格高于卧室更少的房子的现实。这种模式最大的缺点是它不能捕捉到影响房价的多数因素,如浴室数量,地段数量,地点等。
Youcan capture more factors using a tree that has more "splits." Theseare called "deeper" trees. A decision tree that also considers thetotal size of each house's lot might look like this:你可以使用具有更多“分支”的树捕捉到更多因素。这些被称为“更深”的树。决策树也会考虑每个房子的总面积大小可能如下所示:
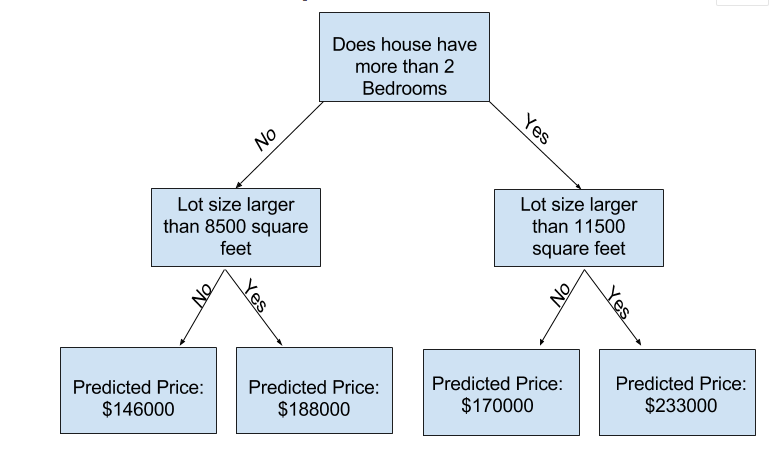
You predict the price of any house by tracing through the decision tree, alwayspicking the path corresponding to that house's characteristics. The predictedprice for the house is at the bottom of the tree. The point at the bottom wherewe make a prediction is called a leaf.你通过在决策树中追踪来预测任何房屋的价格,并始终选择与房屋特征相对应的路径。房子的预测价格在树的底部。在我们做出预测的底部,这个点叫做叶结点。
Thesplits and values at the leaves will be determined by the data, so it's timefor you to check out the data you will be working with.叶上的分割和值将由数据决定,因此你需要检查将要使用的数据。
Continue
You will write code as part of an ongoing data scienceproject for the rest of the tutorials. Click here to get started.你将编写代码作为其余教程的持续数据科学项目的一部分。点击这里开始。
PS:此仅仅翻译了Kaggle课程,有条件的同学请到Kaggle上看。(遇到难点,也会当做学习笔记留在下面)
本文是Kaggle自助学习下的文章,转回到目录点击这里


 1022
1022

 被折叠的 条评论
为什么被折叠?
被折叠的 条评论
为什么被折叠?
 到【灌水乐园】发言


