


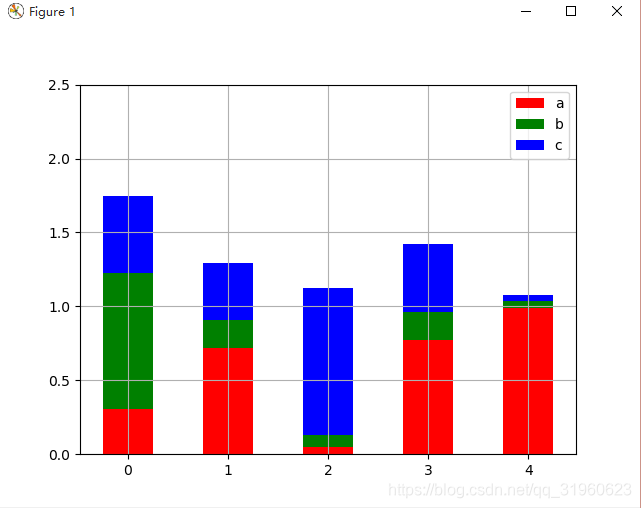
叠加柱状图
import numpy as np
import matplotlib.pyplot as plt

size = 5
a = np.random.random(size)
b = np.random.random(size)
c = np.random.random(size)

x = np.arange(size)

# 这里使用的是偏移
plt.bar(x, a, width=0.5, label='a',fc='r')
plt.bar(x, b, bottom=a, width=0.5, label='b', fc='g')
plt.bar(x, c, bottom=a+b, width=0.5, label='c', fc='b')

plt.ylim(0, 2.5)
plt.legend()
plt.grid(True)
plt.show()


 958
958

 被折叠的 条评论
为什么被折叠?
被折叠的 条评论
为什么被折叠?
 到【灌水乐园】发言


