


 本文详细介绍了如何在Laravel项目中集成Hhxsv5/Laravel-S的Prometheus监控,包括APCu扩展安装、配置中间件、注册ServiceProvider、创建监控接口和配置Prometheus收集器。
本文是对https://github.com/hhxsv5/laravel-s/blob/master/README-CN.md#prometheus
做更详细的解释
1、安装APCu扩展
依赖APCu >= 5.0.0扩展
pecl install apcu
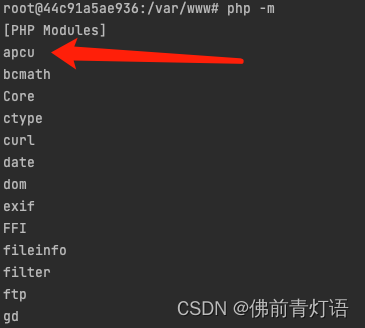
检查安装结果
php -m
安装成功后php.ini配置添加:
extension=apcu.so
apc.enable_cli=1
注意:提一下之前有个APC是旧版本php使用的,现已弃用不再维护,取而代之的是APCu
2、拷贝prometheus配置文件
路径:vendor/hhxsv5/laravel-s/config/prometheus.php,把prometheus.php拷贝到你的Laravel项目config目录项目。
可在laravel根目录下执行命令:
cp vendor/hhxsv5/laravel-s/config/prometheus.php config/
或者你自己找到prometheus.php复制过来
3、配置全局中间件
Hhxsv5\LaravelS\Components\Prometheus\RequestMiddleware::class。为了尽可能精确地统计请求耗时,RequestMiddleware必须作为第一个全局中间件,需要放在其他中间件的前面。
1.打开 app/Http/Kernel.php 文件。
protected $middleware = [
    \Hhxsv5\LaravelS\Components\Prometheus\RequestMiddleware::class,
    // 其他中间件...
];
//将 'prometheus' 中间件名称添加到 $middlewareGroups 数组的 'web' 或 'api' 中,具体取决于你希望将其应用于哪个路由分组。确保将其放在其他中间件之前。
protected $middlewareGroups = [
    'web' => [
        'prometheus',
        // 其他中间件...
    ],

    'api' => [
        'prometheus',
        // 其他中间件...
    ],
];
protected $routeMiddleware = [
    'prometheus' => \Hhxsv5\LaravelS\Components\Prometheus\RequestMiddleware::class,
    // 其他中间件...
];
4、注册 ServiceProvider
打开 config/app.php 文件,找到 providers 数组,然后将 Hhxsv5\LaravelS\Components\Prometheus\ServiceProvider::class 添加到数组中。
'providers' => [
    // 其他服务提供者...
    Hhxsv5\LaravelS\Components\Prometheus\ServiceProvider::class,
],
5、配置 CollectorProcess 进程
用于定时采集 Swoole Worker/Task/Timer 进程的指标,在config/laravels.php中配置:
'processes' => Hhxsv5\LaravelS\Components\Prometheus\CollectorProcess::getDefinition(),
6、创建路由,输出监控指标数据。
就是弄一个接口,请求后返回数据就行
use Hhxsv5\LaravelS\Components\Prometheus\Exporter;

Route::get('/actuator/prometheus', function () {
    $result = app(Exporter::class)->render();
    return response($result, 200, ['Content-Type' => Exporter::REDNER_MIME_TYPE]);
});
你也可以在控制器里实现:
<?php

namespace App\Http\Controllers\Api;

use Hhxsv5\LaravelS\Components\Prometheus\Exporter;

/**
 * @apiDefine debug
 * 运维调试接口
 */
class DebugController extends AbstractController
{
    public function prometheus()
    {
        $result = app(Exporter::class)->render();
        return response($result, 200, ['Content-Type' => Exporter::REDNER_MIME_TYPE]);
    }
}
7、完成Prometheus的配置,启动Prometheus。
global:
  scrape_interval: 5s
  scrape_timeout: 5s
  evaluation_interval: 30s
scrape_configs:
- job_name: laravel-s-test
  honor_timestamps: true
  metrics_path: /actuator/prometheus
  scheme: http
  follow_redirects: true
  static_configs:
  - targets:
    - 127.0.0.1:5200 # The ip and port of the monitored service
# Dynamically discovered using one of the supported service-discovery mechanisms
# https://prometheus.io/docs/prometheus/latest/configuration/configuration/#scrape_config
# - job_name: laravels-eureka
#   honor_timestamps: true
#   scrape_interval: 5s
#   metrics_path: /actuator/prometheus
#   scheme: http
#   follow_redirects: true
  # eureka_sd_configs:
  # - server: http://127.0.0.1:8080/eureka
  #   follow_redirects: true
  #   refresh_interval: 5s
本文主要是PHP开发视角。
另调接口如报错:APC must be enabled to use APCUIterator …
则是apcu安装后php.ini只添加了extension=apcu.so 而没有添加 apc.enable_cli=1 导致cli没有开启导致。


 557
557

 被折叠的 条评论
为什么被折叠?
被折叠的 条评论
为什么被折叠?
 到【灌水乐园】发言


