


 本文介绍QCustomPlot的基本使用方法,包括组件的引入、配置及如何添加数据。此外,还展示了如何设置交互功能,如缩放和平移等。
QCustomPlot的基本使用
QCustomPlot是QT下一个方便易用的绘图工具,只有两个文件qcustomplot.h和qcustomplot.cpp组成。源文件和使用文档可从官方网站下载。
官方网站:http://www.qcustomplot.com/
下面介绍下基本使用:
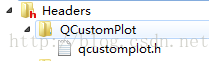
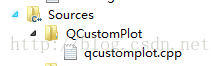
1、将qcustomplot.cpp和qcustomplot.h拷贝到工程目录下,并在工程中添加文件。
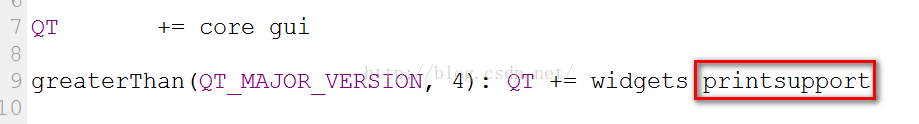
并在工程的pro文件添加printsupport
greaterThan(QT_MAJOR_VERSION, 4): QT += widgets printsupport
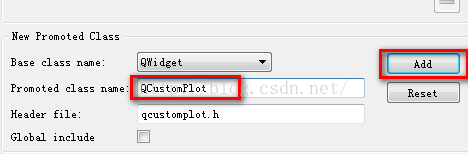
2、在QT里面添加一个Widget命名为qcustomplotWidget,对这个Widget右击,点击Promote to...
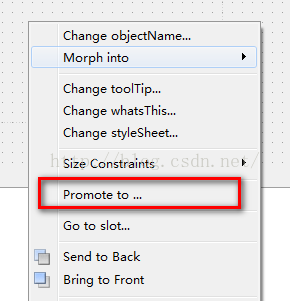
提升类名为QCustomPlot,并点击Add:
最后选中点击Promote:
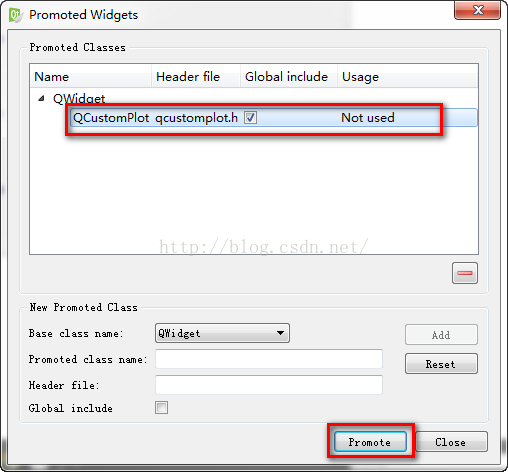
然后就可以在工程中通过ui->qcustomplotWidget直接使用了。
3、通过本人项目来展示相关代码,实际参考了官网上下载的文档和例程:
设置x,y轴:
-
ui->qcustomplot->setInteractions(QCP::iRangeDrag | QCP::iRangeZoom | QCP::iSelectAxes | //设置交互方式 -
QCP::iSelectLegend | QCP::iSelectPlottables); -
// ui->qcustomplot->axisRect()->setupFullAxesBox(); -
QBrush qBrush(QColor(255,255,255));//设置背景色 -
ui->qcustomplot->setBackground(qBrush); -
ui->qcustomplot->legend->setVisible(true); -
ui->qcustomplot->xAxis->setLabel("Time Axis (t/s)");//设置x轴 -
ui->qcustomplot->xAxis->setTicks(false); -
ui->qcustomplot->yAxis->setLabel("EEG Channel");//设置y轴 -
ui->qcustomplot->yAxis->setAutoTicks(true); -
ui->qcustomplot->yAxis->setAutoTickStep(true); -
ui->qcustomplot->yAxis->setAutoSubTicks(true); -
ui->qcustomplot->yAxis->setRange(8000.0,10000.0);
x,y轴更多设置可参考QCPAxis Class。
添加图层:
-
<pre name="code" class="cpp"> graph1 = ui->qcustomplot->addGraph();//增加一条曲线图层 -
graph2 = ui->qcustomplot->addGraph();//增加一条曲线图层 -
//QCPScatterStyle QCPcs1(QCPScatterStyle::ssSquare, QColor(255,0,0),QColor(255,0,0),3);//设置折线图的点的形状及颜色 -
QPen qPen1(QColor(255,0,0)); -
// graph_1->setScatterStyle(QCPcs1); -
graph1->setPen(qPen1);//设置画笔颜色 -
graph1->setData(x,y); -
graph1->setName(QString("F3")); -
//QCPScatterStyle QCPcs2(QCPScatterStyle::ssCircle, QColor(0,255,0),QColor(0,255,0),3);//设置折线图的点的形状及颜色 -
QPen qPen2(QColor(0,255,0)); -
// graph2->setScatterStyle(QCPcs2); -
graph2->setPen(qPen2);//设置画笔颜色 -
graph2->setData(x,y); -
graph2->setName(QString("F4"));
图层更多使用情况可参考QCustomPlot Class。
添加数据:
可用graph1->addData()函数,具体函数参数为
-
void addData (const QCPDataMap &dataMap) -
void addData (const QCPData &data) -
void addData (double key, double value) -
void addData (const QVector< double > &keys, const QVector< double > &values)
4、如果要实现对图的缩放移动,可以添加一下槽函数:
-
/** -
* @brief MainWindow::mousePress -
* 鼠标点击 -
*/ -
void MainWindow::mousePress() -
{ -
// if an axis is selected, only allow the direction of that axis to be dragged -
// if no axis is selected, both directions may be dragged -
if (ui->qcustomplotWidget->xAxis->selectedParts().testFlag(QCPAxis::spAxis)) -
{ -
ui->qcustomplotWidget->axisRect()->setRangeDrag(ui->qcustomplotWidget->xAxis->orientation()); -
} -
else if (ui->qcustomplotWidget->yAxis->selectedParts().testFlag(QCPAxis::spAxis)) -
{ -
ui->qcustomplotWidget->axisRect()->setRangeDrag(ui->qcustomplotWidget->yAxis->orientation()); -
} -
else -
{ -
ui->qcustomplotWidget->axisRect()->setRangeDrag(Qt::Horizontal|Qt::Vertical); -
} -
} -
/** -
* @brief MainWindow::mouseWheel -
* 鼠标滚轮 -
*/ -
void MainWindow::mouseWheel() -
{ -
// if an axis is selected, only allow the direction of that axis to be zoomed -
// if no axis is selected, both directions may be zoomed -
if (ui->qcustomplotWidget->xAxis->selectedParts().testFlag(QCPAxis::spAxis)) -
{ -
ui->qcustomplotWidget->axisRect()->setRangeZoom(ui->qcustomplotWidget->xAxis->orientation()); -
} -
else if (ui->qcustomplotWidget->yAxis->selectedParts().testFlag(QCPAxis::spAxis)) -
{ -
ui->qcustomplotWidget->axisRect()->setRangeZoom(ui->qcustomplotWidget->yAxis->orientation()); -
} -
else -
{ -
ui->qcustomplotWidget->axisRect()->setRangeZoom(Qt::Horizontal|Qt::Vertical); -
} -
} -
/** -
* @brief MainWindow::selectionChanged -
* 曲线选择 -
*/ -
void MainWindow::selectionChanged() -
{ -
/* -
normally, axis base line, axis tick labels and axis labels are selectable separately, but we want -
the user only to be able to select the axis as a whole, so we tie the selected states of the tick labels -
and the axis base line together. However, the axis label shall be selectable individually. -
The selection state of the left and right axes shall be synchronized as well as the state of the -
bottom and top axes. -
Further, we want to synchronize the selection of the graphs with the selection state of the respective -
legend item belonging to that graph. So the user can select a graph by either clicking on the graph itself -
or on its legend item. -
*/ -
// make top and bottom axes be selected synchronously, and handle axis and tick labels as one selectable object: -
if (ui->qcustomplotWidget->xAxis->selectedParts().testFlag(QCPAxis::spAxis) || ui->qcustomplotWidget->xAxis->selectedParts().testFlag(QCPAxis::spTickLabels) || -
ui->qcustomplotWidget->xAxis2->selectedParts().testFlag(QCPAxis::spAxis) || ui->qcustomplotWidget->xAxis2->selectedParts().testFlag(QCPAxis::spTickLabels)) -
{ -
ui->qcustomplotWidget->xAxis2->setSelectedParts(QCPAxis::spAxis|QCPAxis::spTickLabels); -
ui->qcustomplotWidget->xAxis->setSelectedParts(QCPAxis::spAxis|QCPAxis::spTickLabels); -
} -
// make left and right axes be selected synchronously, and handle axis and tick labels as one selectable object: -
if (ui->qcustomplotWidget->yAxis->selectedParts().testFlag(QCPAxis::spAxis) || ui->qcustomplotWidget->yAxis->selectedParts().testFlag(QCPAxis::spTickLabels) || -
ui->qcustomplotWidget->yAxis2->selectedParts().testFlag(QCPAxis::spAxis) || ui->qcustomplotWidget->yAxis2->selectedParts().testFlag(QCPAxis::spTickLabels)) -
{ -
ui->qcustomplotWidget->yAxis2->setSelectedParts(QCPAxis::spAxis|QCPAxis::spTickLabels); -
ui->qcustomplotWidget->yAxis->setSelectedParts(QCPAxis::spAxis|QCPAxis::spTickLabels); -
} -
// synchronize selection of graphs with selection of corresponding legend items: -
for (int i=0; i<ui->qcustomplotWidget->graphCount(); ++i) -
{ -
QCPGraph *graph = ui->qcustomplotWidget->graph(i); -
QCPPlottableLegendItem *item = ui->qcustomplotWidget->legend->itemWithPlottable(graph); -
if (item->selected() || graph->selected()) -
{ -
item->setSelected(true); -
graph->setSelected(true); -
} -
} -
}
并连接信号:
-
connect(ui->qcustomplotWidget, SIGNAL(mousePress(QMouseEvent*)), this, SLOT(mousePress()));//连接鼠标点击信号和槽 -
connect(ui->qcustomplotWidget, SIGNAL(mouseWheel(QWheelEvent*)), this, SLOT(mouseWheel()));//连接鼠标滚轮信号和槽 -
connect(ui->qcustomplotWidget, SIGNAL(selectionChangedByUser()), this, SLOT(selectionChanged()));//连接曲线选择信号和槽
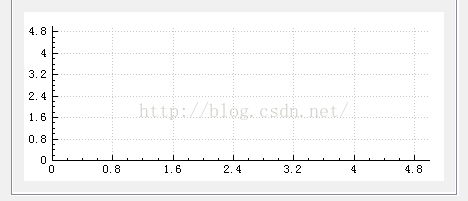
最后效果图:


 297
297

 被折叠的 条评论
为什么被折叠?
被折叠的 条评论
为什么被折叠?
 到【灌水乐园】发言


