


 本文详细介绍GPROF性能测试工具的使用方法,通过实例演示如何利用GCC自带的GPROF进行性能分析,包括编译开关设置、程序执行及生成性能报告的全过程。
本文转自:https://blog.youkuaiyun.com/luchengtao11/article/details/74910585
一、前言
参考GPROF用户数手册:http://sourceware.org/binutils/docs-2.17/gprof/index.html
参考博客:http://blog.youkuaiyun.com/stanjiang2010/article/details/5655143
GPROF是GCC自带的性能测试工具,可以统计出各个函数的调用次数、时间、以及函数调用图。
二、教程
使用GRPOF分为三个步骤
(1)编译时候打开编译开关,-pg
(2)运行程序(程序一定要正常运行完毕才会生成性能报告)
(3)运行性能测试工具来生成报告。
1.编码
这里编写一个示例代码,随后对其进行性能测试
//test_gprof.c
#include<stdio.h>

void new_func1(void);

void func1(void)
{
    printf("\n Inside func1 \n");
    int i = 0;

    for(;i<0xffffffff;i++);
    new_func1();

    return;
}

static void func2(void)
{
    printf("\n Inside func2 \n");
    int i = 0;

    for(;i<0xffffffaa;i++);
    return;
}

int main(void)
{
    printf("\n Inside main()\n");
    int i = 0;

    for(;i<0xffffff;i++);
    func1();
    func2();

    return 0;
}
//test_gprof_new.c
#include<stdio.h>

void new_func1(void)
{
    printf("\n Inside new_func1()\n");
    int i = 0;

    for(;i<0xffffffee;i++);

    return;
}
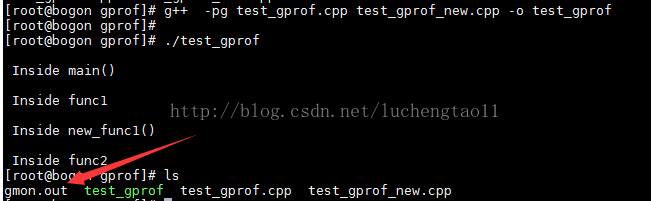
2.编译并执行
g++ -pg test_gprof.cpp test_gprof_new.cpp -o test_gprof
可以看到执行后会新生成一个gmon.out文件
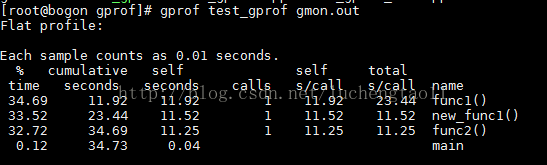
3.运行性能测试工具
gprof test_gprof gmon.out可以看到各种参数跃然于屏上
(1)flat profile,包括每个函数的调用次数,以及每个函数消耗的处理器时间
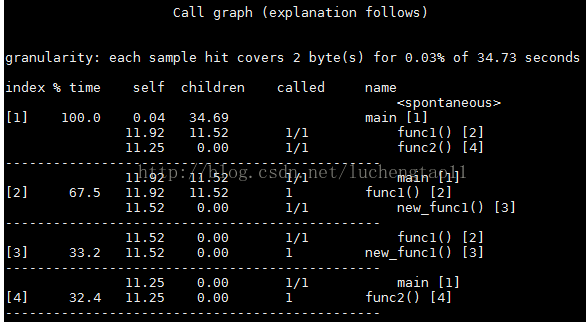
(2)call graph包括函数的调用关系,每个函数调用花费的时间


 2725
2725

 被折叠的 条评论
为什么被折叠?
被折叠的 条评论
为什么被折叠?
 到【灌水乐园】发言


