


ONLY FOR SELF STUDY, NO COMMERCIAL USAGE!!!
Contents
-
- ***ONLY FOR SELF STUDY, NO COMMERCIAL USAGE!!!***
- Chapter 8. Troubleshooting Ansible
-
- Troubleshooting Playbooks
- Troubleshooting Ansible Managed Hosts
- Chapter 8 Example
Chapter 8. Troubleshooting Ansible
Troubleshooting Playbooks
Debugging Playbooks
The output provided by the ansible-navigator run command is a good starting point for troubleshooting issues with your plays and the hosts on which they run.
You can increase the verbosity of the output by adding one or more -v options. The ansible-navigator run -v command provides additional debugging information, with up to four total levels.
Table 8.1. Verbosity Configuration
| Option | Description |
|---|---|
-v |
The output data is displayed. |
-vv |
Both the output and input data are displayed. |
-vvv |
Includes information about connections to managed hosts. |
-vvvv |
Includes additional information, such as the scripts that are executed on each remote host, and the user that is executing each script. |
Examining Values of Variables with the Debug Module
You can use the ansible.builtin.debug module to provide insight into what is happening in the play. You can create a task that uses this module to display the value for a given variable at a specific point in the play.
The following examples use the msg and var settings inside ansible.builtin.debug tasks. This first example displays the value at run time of the ansible_facts['memfree_mb'] fact as part of a message printed to the output of ansible-navigator run.
- name: Display free memory
  ansible.builtin.debug:
    msg: "Free memory for this system is {

   { ansible_facts['memfree_mb'] }}"
This second example displays the value of the output variable.
- name: Display the "output" variable
  ansible.builtin.debug:
    var: output
    verbosity: 2
The verbosity parameter controls when the ansible.builtin.debug module is executed. The value correlates to the number of -v options that are specified when the playbook is run. For example, if -vv is specified, and verbosity is set to 2 for a task, then that task is included in the debug output. The default value of the verbosity parameter is 0.
Reviewing Playbooks for Errors
Several issues can occur during a playbook run, many related to the syntax of either the playbook or any of the templates it uses, or due to connectivity issues with the managed hosts (for example, an error in the host name of the managed host in the inventory file).
A number of tools are available that you can use to review your playbook for syntax errors and other problems before you run it.
Checking Playbook Syntax for Problems
The ansible-navigator run command accepts the --syntax-check option, which tests your playbook for syntax errors instead of actually running it.
It is a good practice to validate the syntax of your playbook before using it or if you are having problems with it.
[student@demo ~]$ ansible-navigator run \
> -m stdout playbook.yml --syntax-check
Checking a Given Task in a Playbook
You can use the ansible-navigator run command with the --step option to step through a playbook, one task at a time.
The ansible-navigator run --step command interactively prompts for confirmation that you want each task to run. Press Y to confirm that you want the task to run, N to skip the task, or C to continue running the remaining tasks.
[student@demo ~]$ ansible-navigator run \
> -m stdout playbook.yml --step --pae false

PLAY [Managing errors playbook] **********************************************
Perform task: TASK: Gathering Facts (N)o/(y)es/(c)ontinue:
Because Ansible prompts you for input when you use the --step option, you must disable playbook artifacts and use standard output mode.
You can also start running a playbook from a specific task by using the --start-at-task option. Provide the name of a task as an argument to the ansible-navigator run --start-at-task command.
For example, suppose that your playbook contains a task named Ensure {
{ web_service }} is started. Use the following command to run the playbook starting at that task:
[student@demo ~]$ ansible-navigator run \
> -m stdout playbook.yml --start-at-task "Ensure {

  { web_service }} is started"
You can use the ansible-navigator run --list-tasks command to list the task names in your playbook.
Checking Playbooks for Issues and Following Good Practices
One of the best ways to make it easier for you to debug playbooks is for you to follow good practices when writing them in the first place. Some recommended practices for playbook development include:
- Use a concise description of the play’s or task’s purpose to name plays and tasks. The play name or task name is displayed when the playbook is executed. This also helps document what each play or task is supposed to accomplish, and possibly why it is needed.
- Use comments to add additional inline documentation about tasks.
- Make effective use of vertical white space. In general, organize task attributes vertically to make them easier to read.
- Consistent horizontal indentation is critical. Use spaces, not tabs, to avoid indentation errors. Set up your text editor to insert spaces when you press the
Tabkey to make this easier. - Try to keep the playbook as simple as possible. Only use the features that you need.
See Good Practices for Ansible .
To help you follow good practices like these, Red Hat Ansible Automation Platform 2 provides a tool, ansible-lint, that uses a set of predefined rules to look for possible issues with your playbook. Not all the issues that it reports break your playbook, but a reported issue might indicate the presence of a more serious error.
Important:
The ansible-lint command is a Technology Preview in Red Hat Ansible Automation Platform 2.2. Red Hat does not yet fully support this tool; for details, see the Knowledgebase article “What does a “Technology Preview” feature mean?”.
For example, assume that you have the following playbook, site.yml:
- name: Configure servers with Ansible tools
  hosts: all  #(1)

  tasks:
    - name: Make sure tools are installed
      package: #(2)
        name:  #(3)
          - ansible-doc
          - ansible-navigator  #(4)
Run the ansible-lint site.yml command to validate it. You might get the following output as a result:
WARNING  Overriding detected file kind 'yaml' with 'playbook' for given positional argument: site.yml
WARNING  Listing 4 violation(s) that are fatal
yaml: trailing spaces (trailing-spaces)
site.yml:2

fqcn-builtins: Use FQCN for builtin actions.
site.yml:5 Task/Handler: Make sure tools are installed

yaml: trailing spaces (trailing-spaces)
site.yml:7

yaml: too many blank lines (1 > 0) (empty-lines)
site.yml:10

You can skip specific rules or tags by adding them to your configuration file:
# .config/ansible-lint.yml
warn_list:  # or 'skip_list' to silence them completely
  - fqcn-builtins  # Use FQCN for builtin actions.
  - yaml  # Violations reported by yamllint.

Finished with 4 failure(s), 0 warning(s) on 1 files.
This run of ansible-lint found four style issues:
| 1 | Line 2 of the playbook (hosts: all) apparently has trailing white space, detected by the yaml rule. It is not a problem with the playbook directly, but many developers prefer not to have trailing white space in files stored in version control to avoid unnecessary differences as files are edited. |
|---|---|
| 2 | Line 5 of the playbook (package:) does not use a FQCN for the module name on that task. It should be ansible.builtin.package: instead. This was detected by the fqcn-builtins rule. |
| 3 | Line 7 of the playbook also apparently has trailing white space. |
| 4 | The playbook ends with one or more blank lines, detected by the yaml rule. |
The ansible-lint tool uses a local configuration file, which is either the .ansible-lint or .config/ansible-lint.yml file in the current directory. You can edit this configuration file to convert rule failures to warnings (by adding them as a list to the warn_list directive) or skip the checks entirely (by adding them as a list to the skip_list directive).
If you have a syntax error in the playbook, ansible-lint reports it just like ansible-navigator run --syntax-check does.
After you correct these style issues, the ansible-lint site.yml report is as follows:
WARNING Overriding detected file kind 'yaml' with 'playbook' for given positional argument: site.yml
This is an advisory message that you can ignore, and the lack of other output indicates that ansible-lint did not detect any other style issues.
For more information on ansible-lint, see https://docs.ansible.com/lint.html and the ansible-lint --help command.
Important
The ansible-lint command evaluates your playbook based on the software on your workstation. It does not use the automation execution environment container that is used by ansible-navigator.
The ansible-navigator command has an experimental lint option that runs ansible-lint in your automation execution environment, but the ansible-lint tool needs to be installed inside the automation execution environment’s container image for the option to work. This is currently not the case with the default execution environment. You need a custom execution environment to run ansible-navigator lint at this time.
In addition, the version of ansible-lint provided with Red Hat Ansible Automation Platform 2.2 assumes that your playbooks are using Ansible Core 2.13, which is the version currently used by the default execution environment. It does not support earlier Ansible 2.9 playbooks.
Reviewing Playbook Artifacts and Log Files
Red Hat Ansible Automation Platform can log the output of playbook runs that you make from the command line in a number of different ways.
ansible-navigatorcan produce playbook artifacts that store information about runs of playbooks in JSON format.- You can log information about playbook runs to a text file in a location on the system to which you can write.
Playbook Artifacts from Automation Content Navigator
The ansible-navigator command produces playbook artifact files by default each time you use it to run a playbook. These files record information about the playbook run, and can be used to review the results of the run when it completes, to troubleshoot issues, or be kept for compliance purposes.
Each playbook artifact file is named based on the name of the playbook you ran, followed by the word artifact, and then the time stamp of when the playbook was run, ending with the .json file extension.
For example, if you run the command ansible-navigator run site.yml at 20:00 UTC on July 22, 2022, the resulting file name of the artifact file could be:
site-artifact-2022-07-22T20:00:04.019343+00:00.json
You can review the contents of these files with the ansible-navigator replay command. If you include the -m stdout option, then the output of the playbook run is printed to your terminal as if it had just run. However, if you omit that option, you can examine the results of the run interactively.
For example, you run the following playbook, site.yml, and it fails but you do not know why. You run ansible-navigator run site.yml --syntax-check and the ansible-lint command, but neither command reports any issues.
- name: Configure servers with Ansible tools
  hosts: all

  tasks:
    - name: Make sure tools are installed
      ansible.builtin.package:
        name:
          - ansible-doc
          - ansible-navigator
To troubleshoot further, you run ansible-navigator replay in interactive mode on the resulting artifact file, which opens the following output in your terminal:
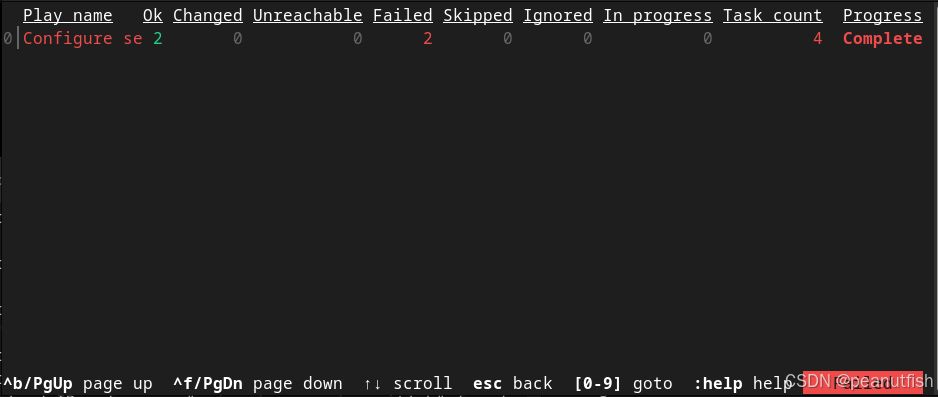
Figure 8.1: Initial replay screen
If you enter :0 to view the play, the following output is printed:

Figure 8.2: Play results by machine and task
It looks like the task Make sure tools are installed failed on both the server-1.example.com and server-2.example.com hosts. By entering :2, you can look at the failure for the server-2.example.com host:
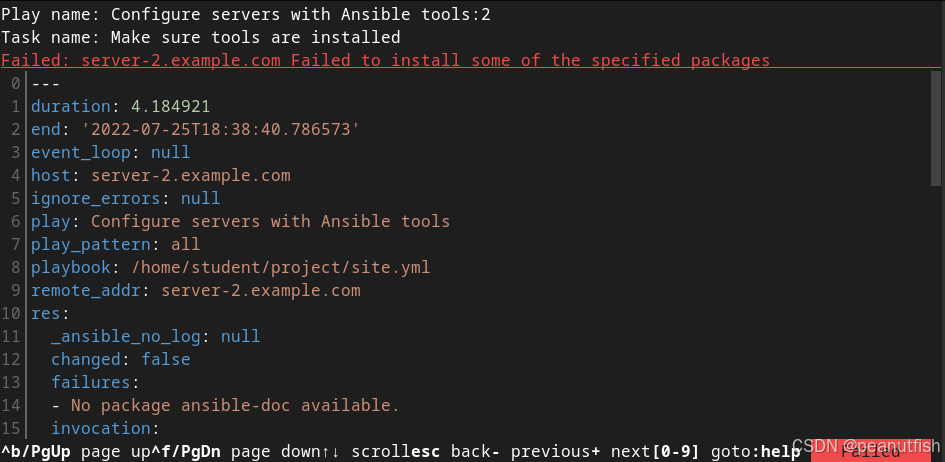
Figure 8.3: Task results for a specific machine
The task is attempting to use the ansible.builtin.package module to install the ansible-doc package, and that package is not available in the RPM package repositories used by the server-2.example.com host, so the task failed. (You might discover that the ansible-doc command is now provided as part of the ansible-navigator RPM package as the ansible-navigator doc command, and changing the task accordingly fixes the problem.)
Another useful thing to know is that you can look at the results of a successful Gathering Facts task and the debugging output includes the values of all the facts that were gathered:
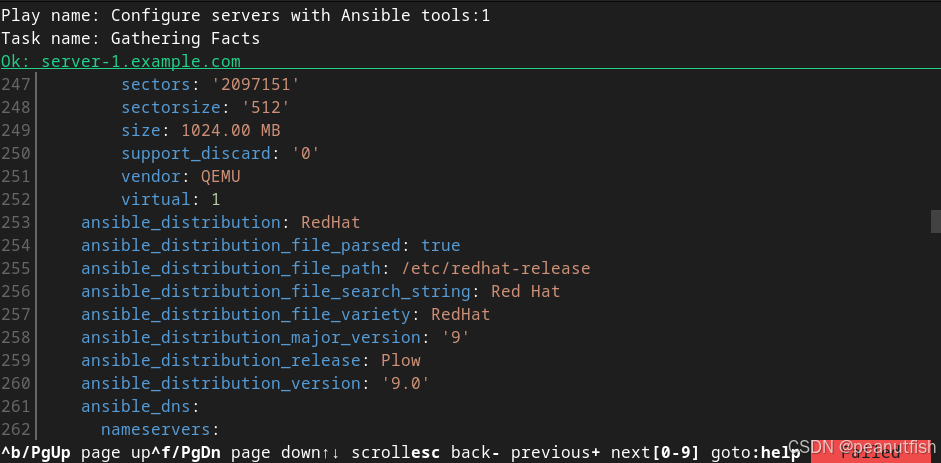
Figure 8.4: Task results for successful fact gathering
This can help you debug issues involving Ansible facts without adding a task to the play that uses the ansible.builtin.debug module to print out fact values.
You might not want to save playbook artifacts for several reasons.
- You are concerned about sensitive information being saved in the log file.
- You need to provide interactive input, such as a password, to
ansible-navigatorfor some reason. - You do not want the files to clutter up the project directory.
You can keep the files from being generated by creating an ansible-navigator.yml file in the project directory that disables the playbook artifacts:
ansible-navigator:
  playbook-artifact:
    enable: false
Logging Output to a Text File
Ansible provides a built-in logging infrastructure that can be configured through the log_path parameter in the default section of the ansible.cfg configuration file, or through the $ANSIBLE_LOG_PATH environment variable. The environment variable takes precedence over the configuration file if both are configured. If a logging path is configured, then Ansible stores o
 最低0.47元/天 解锁文章


 1327
1327

 被折叠的 条评论
为什么被折叠?
被折叠的 条评论
为什么被折叠?
 到【灌水乐园】发言


