


 本教程详细介绍了如何在Python环境中使用seisplot库绘制地震信号图。首先,从github下载代码并安装必要的依赖包,如matplotlib、numpy等。当遇到matplotlib版本过高导致的问题时,降级至3.2.2版本。接着,修改config.yml文件,并安装segyio。最后,通过运行seisplot.py --demo生成示例图像。用户可以将自己的SEGY数据放入data文件夹,使用seisplot.py --datamysegy.sgy运行自定义数据,结果同样保存在data目录下。Anaconda虚拟环境中的操作步骤相同。
seisplot 使用绘制地震信号图运行demo
github代码:https://github.com/agile-geoscience/seisplot
下载code到本地,进入文件目录cmd.
python seisplot.py --demo 如果出现错误 >>>>
pycharm打开下载的文件
首先安装好需要用的包
- matplotlib
- numpy
- obspy
- pillow
- pyyaml
如: pip install matplotlib
然后点击运行seisplot.py 文件,如果出现错误
cannot import name 'makeMappingArray' from 'matplotlib.colors'
这代表你的matplotlib 版本过高
点击终端,输入命令:
pip install matplotlib==3.2.2
继续点击运行seisplot.py 文件,如果出现错误
UnicodeDecodeError: 'gbk' codec can't decode byte 0x99 in position 2003: illegal multibyte sequence
找到文件config.yml,双击进去,将82-84行所有单引号删除,删除后代码为:
# Interpolate variable density display. Acceptable values are none, nearest,
# bilinear, bicubic, spline16, spline36, hanning, hamming, hermite,
# kaiser, quadric, catrom, gaussian, bessel, mitchell, sinc, lanczos.
interpolation: 'bicubic'
继续点击运行seisplot.py 文件,如果出现错误
UnboundLocalError: local variable 'segyio' referenced before assignment
运行
pip install segyio
继续点击运行seisplot.py 文件,如果成功运行
在终端运行demo文件,输入
python seisplot.py --demo
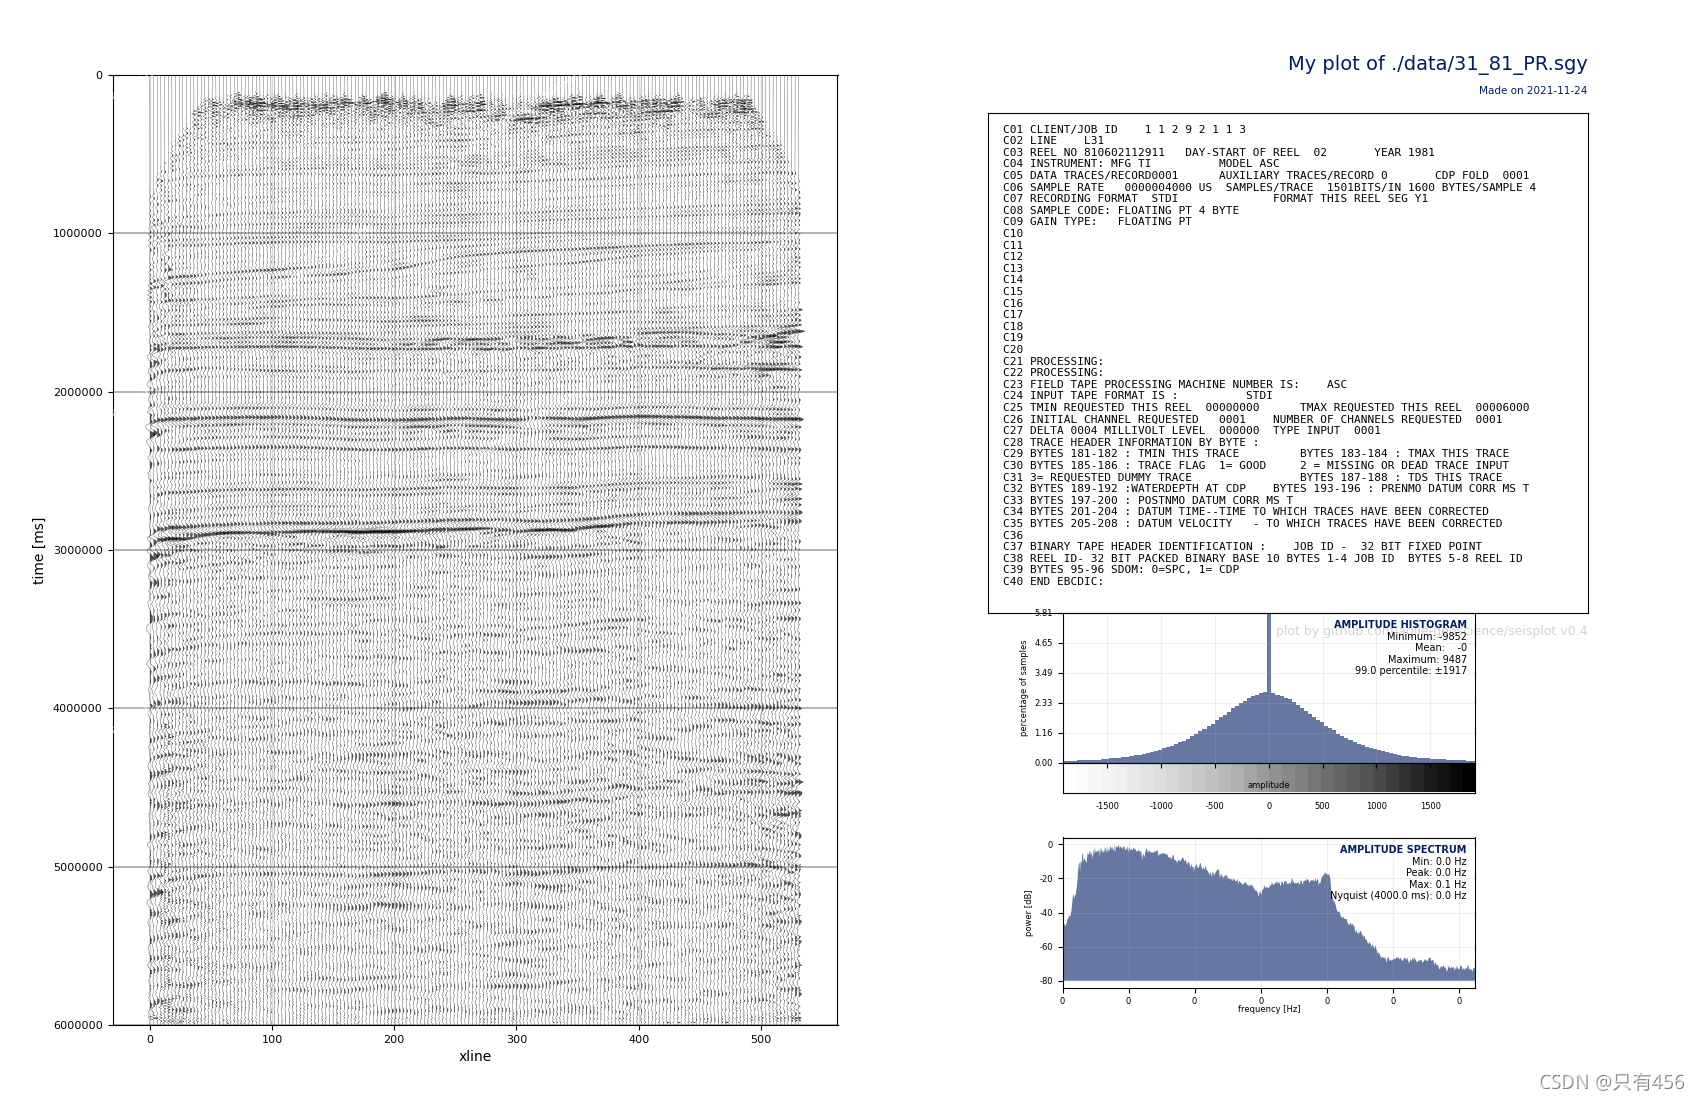
运行结果为:
F:\Anaconda3\lib\site-packages\matplotlib\backends\backend_agg.py:183: RuntimeWarning: Glyph 28431 missing from current font.
  font.set_text(s, 0, flags=flags)
?[94moutput file ./data\31_81_PR.png?[0m
?[92mSaved output in 1.3 s?[0m
?[95m
++++++++++++++++++++++++++++++++++++++++++++++++++++++++
DONE?[0m
运行结果存入data文件夹,结果为png的图.
双击点开
接下来,你就可以运行自己的数据啦!
将你的segy数据(mysegy.sgy)存入data文件中
格式是这个样子的
python seisplot.py --data\mysegy.sgy
成功运行,结果还是存入data中的,如果在pycharm没看到(没刷新),直接从我的电脑进去找到这个文件夹得地方就看到了.


 被折叠的 条评论
为什么被折叠?
被折叠的 条评论
为什么被折叠?
 到【灌水乐园】发言


