


 本文介绍了如何在微信小程序中集成ECharts-for-Weixin项目,通过步骤一到四详细阐述了下载、引入组件、创建页面及配置JSON文件的过程。在WXML中使用组件,并展示了初始化图表的JavaScript代码,包括数据设置、样式配置等,以创建一个条形图。此教程适用于希望在微信小程序中实现数据可视化的开发者。
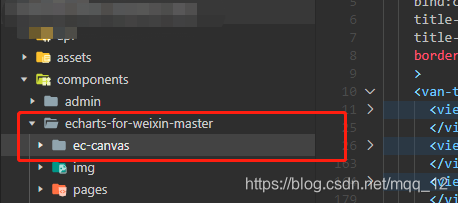
一 首先,下载 GitHub 上的 ecomfe/echarts-for-weixin 项目。
二 仅拷贝 ec-canvas 目录到新建的项目下,然后做相应的调整。
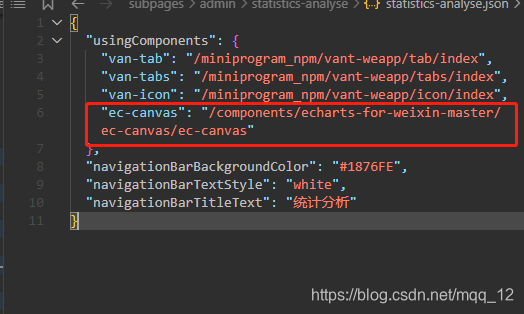
三 创建一个页面文件,.json文件引入组件
四 .wxml 中使用 组件。注意路径的相对位置要写对。
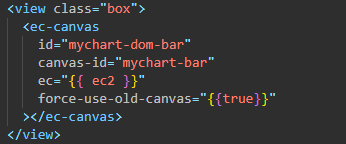
其中 ec 是一个我们在 index.js 中定义的对象,它使得图表能够在页面加载后被初始化并设置
五
import * as echarts from '../../../components/echarts-for-weixin-master/ec-canvas/echarts';
let chart = null;
// 进行初始化数据
function initChart(canvas, width, height) {
  const chart = echarts.init(canvas, null, {
    width: width,
    height: height
  });
  canvas.setChart(chart);

  var option = {
    color: ['#37a2da'],
    xAxis: [
      {
        type: 'category',
        data: [{
          value: '地砖/墙砖',
          textStyle: {
            fontSize: 12,
            color: '#333333'
          },
        },{
          value: '木工',
          textStyle: {
            fontSize: 12,
            color: '#333333'
          }
        },{
          value: '管道疏通',
          textStyle: {
            fontSize: 12,
            color: '#333333'
          }
        },{
          value: '门锁',
          textStyle: {
            fontSize: 12,
            color: '#333333'
          }
        },{
          value: '其他',
          textStyle: {
            fontSize: 12,
            color: '#333333'
          }
        },],
        axisLine: {
          show:true,
          lineStyle: {
            color: '#f2f2f2',
          }
        },
        axisLabel: {
          color: '#333',
          show: true,
          interval: 0,
          rotate: 25
        },
      }
    ],
    yAxis:[
      {
        type: 'value',
        axisLine: {
          lineStyle: {
            color: '#f2f2f2'
          }
        },
        axisLabel: {
          color: '#999'
        },
        splitLine:{
          show: true,
          lineStyle: {
            color: '#f2f2f2'
          }
        },
      }
    ],
    series: [{
      data: [120, 250, 150, 80, 50, 110, 130],
      type: 'bar',
      barWidth : 20,
      label: {
        show: true,
        position: 'top',
        color: '#C6C6C6',
        padding: [5, 6, 5, 6]
      },
      showBackground: true,
      backgroundStyle: {
          color: 'rgba(220, 220, 220, 0.8)'
      },
      itemStyle: {
        color: new echarts.graphic.LinearGradient(
            0, 0, 0, 1,
            [
              {offset: 0, color: '#4BCFFE'},
              {offset: 0.5, color: '#41B4FE'},
              {offset: 1, color: '#3392FF'}
            ]
        )
      },
    }]
  };
  chart.setOption(option);
  return chart;
}

Page({
  data: {
    ec: {
      onInit: initChart
    }
  }
});


 2185
2185

 被折叠的 条评论
为什么被折叠?
被折叠的 条评论
为什么被折叠?
 到【灌水乐园】发言


