<template>
    <div id="app">
        <div id="Map" ref="map"></div>
    </div>
</template>
<script>
import "ol/ol.css";
import VectorSource from "ol/source/Vector";
import { Tile as TileLayer, Heatmap as HeatmapLayer } from "ol/layer";
import XYZ from "ol/source/XYZ";
import { Map, View, Feature } from "ol";
import { Point } from "ol/geom";
import { defaults as defaultControls } from "ol/control";
import { fromLonLat } from "ol/proj";

export default {
    data() {
        return {
            map: null,
        };
    },
    methods: {
        /**
        * 初始化地图
        */
        initMap() {
            this.map = new Map({
                target: "Map",
                controls: defaultControls({
                    zoom: true,
                }).extend([]),


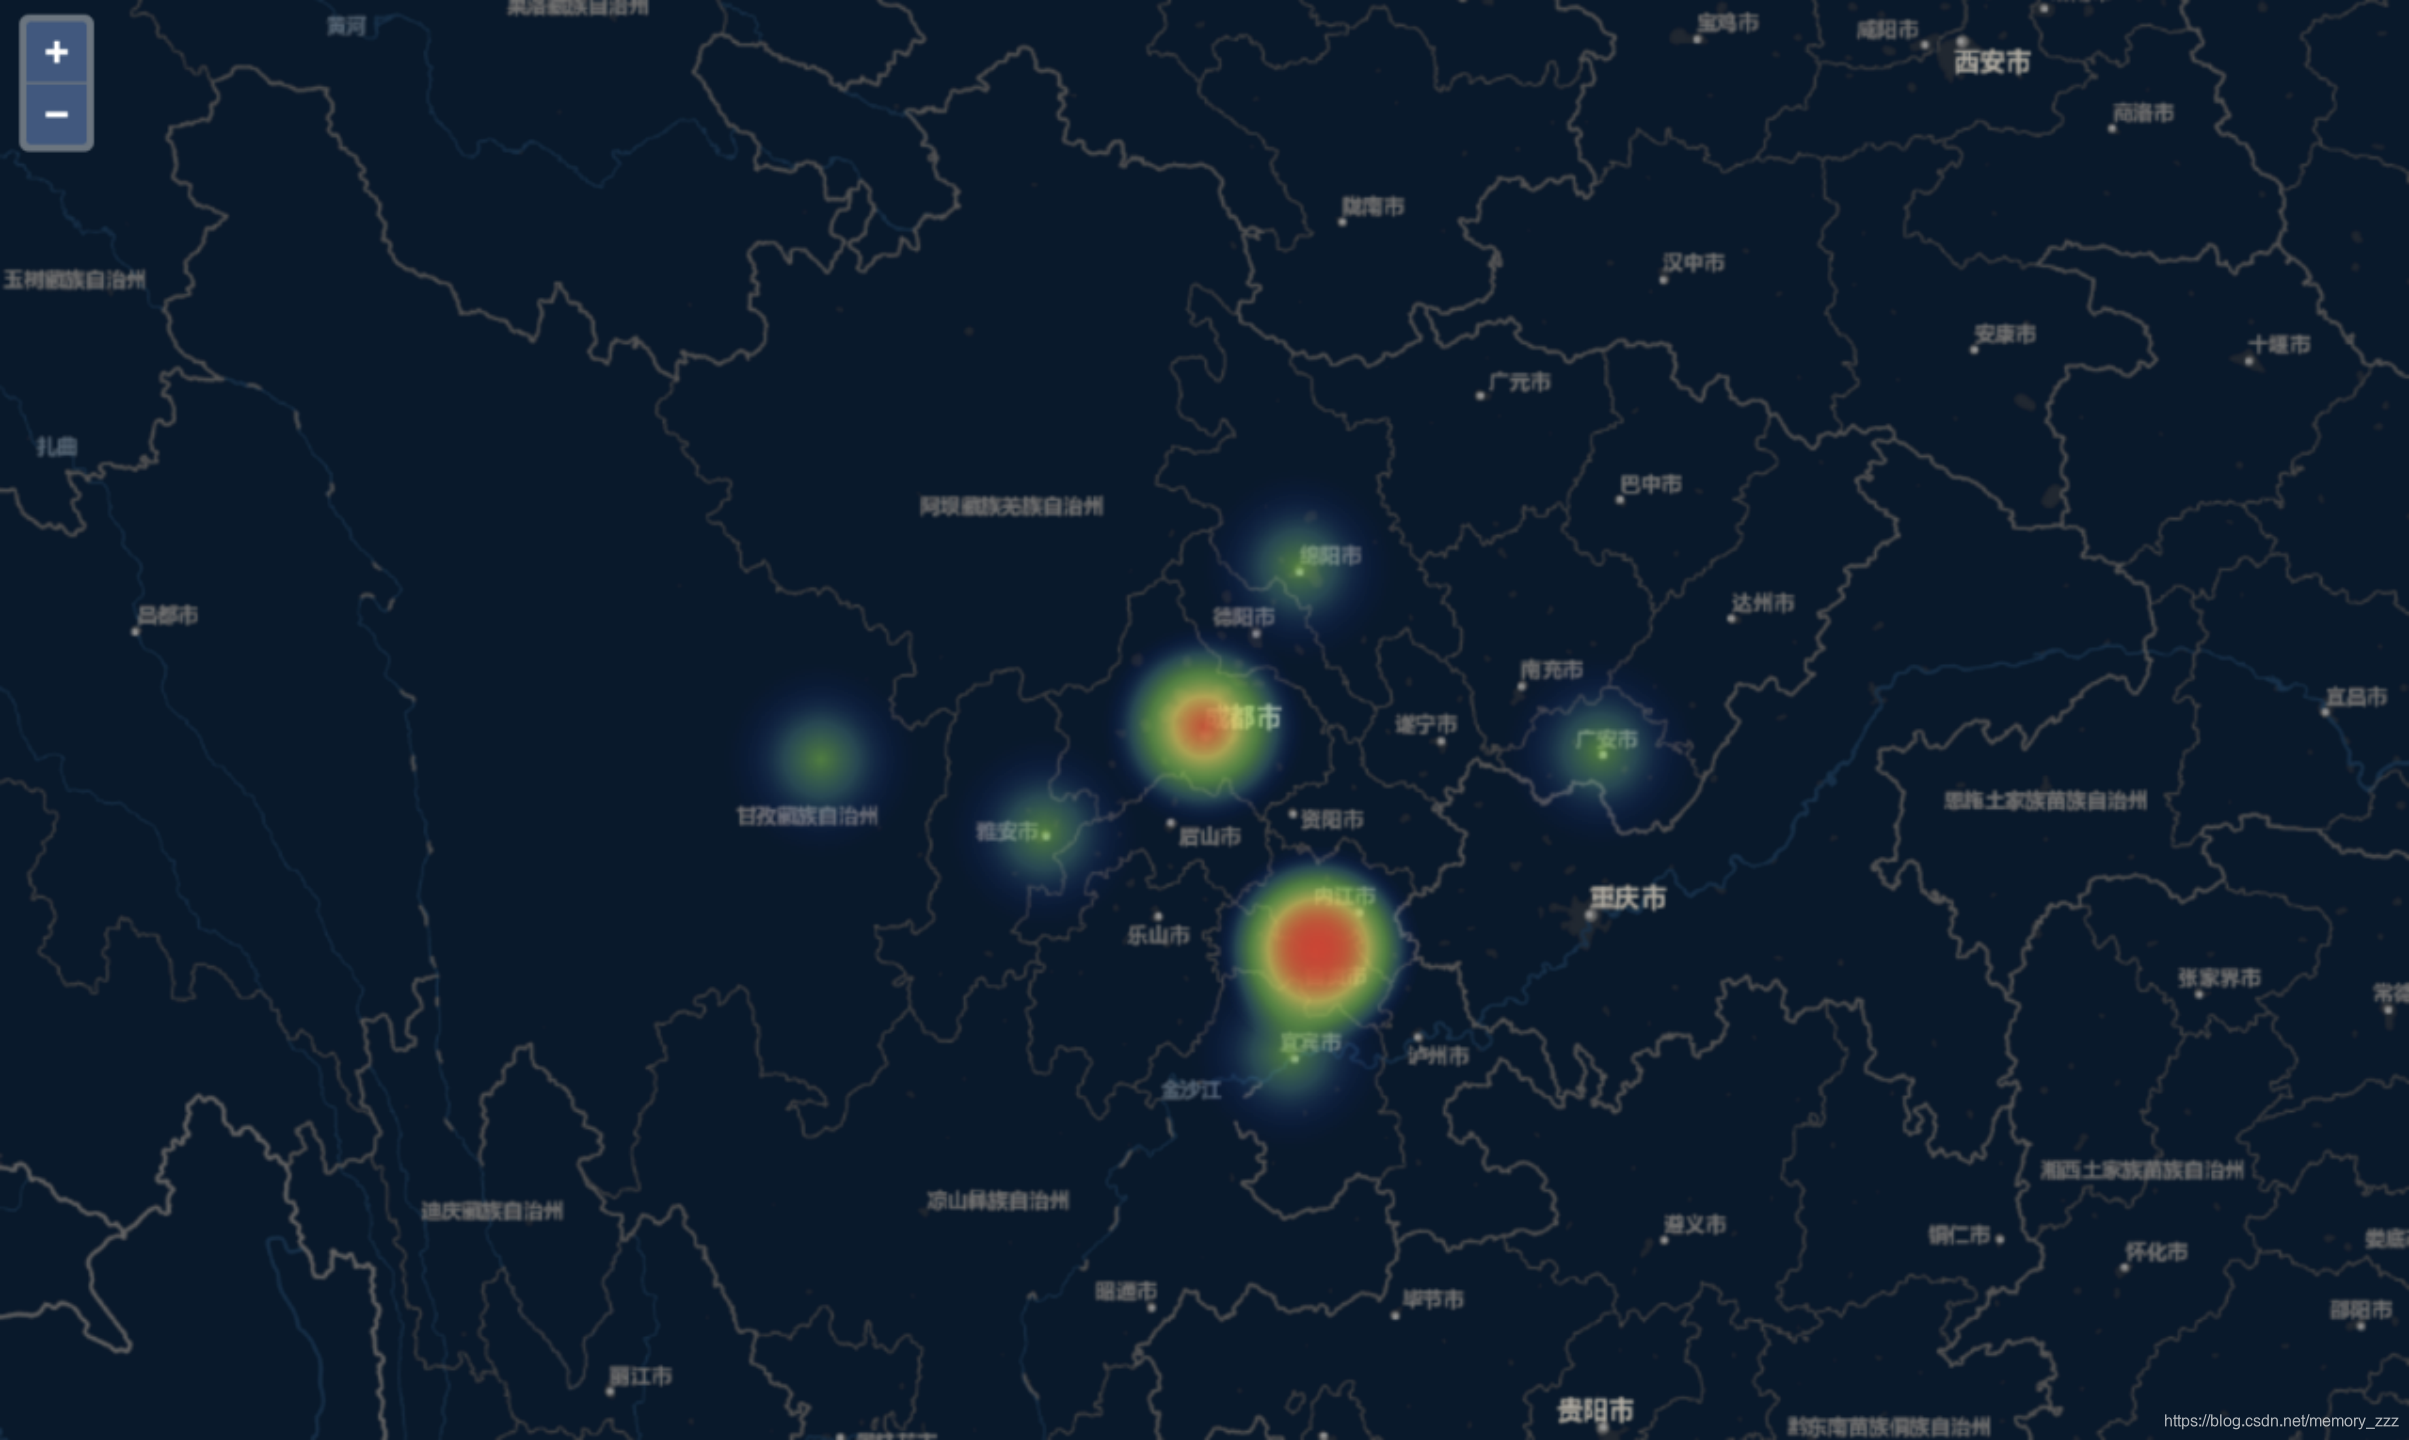
 本文展示了一个使用OpenLayers库创建热力图的应用实例。该示例通过加载四川省多个城市的地理位置数据并设置不同的颜色梯度来展示不同城市的热度分布。
 最低0.47元/天 解锁文章


 1677
1677


 到【灌水乐园】发言


