


✅作者简介:热爱科研的Matlab仿真开发者,修心和技术同步精进,matlab项目合作可私信。
🍎个人主页:Matlab科研工作室
🍊个人信条:格物致知。
更多Matlab仿真内容点击👇
⛄ 内容介绍
针对无线传感器网络的功耗问题,在LEACH算法的基础上做了改进.参考LEACH算法的耗能模型,将待测区域分区并引入路由节点.同时将剩余能量引入选举簇头阈值,使无线传感网络的功耗得到优化.MATLAB仿真结果表明:改进算法使网络的能耗降低和生存周期变长.
⛄ 部分代码
%%
% *Simulate the basic processes of UWSN in Matlab...*
%% *Basic Operation*
%%
% *Remove specified figure:*
%%
% _Deletes the current figure or the specified figure(s)._
close all
%%
% *Remove items from workspace, freeing up system memory:*
%%
% _Removes all variables from the current workspace, releasing them from_
% _system memory._
clear all
%%
% *Clear Command Window:*
%%
% _Clears all input and output from the Command Window display, giving you_
% _a "cleanscreen"._
clc
%%
% *You can choose number of nodes:*
%%
% _The UWSN is built of "nodes" �from a few to several hundreds or even_
% _thousands, where each node is connected to one (or sometimes several)_
% _sensors._
n =50;
%%
% *You can choose length of the network:*
w = 2*n;
%%
% *You can choose width of the network:*
h = 2*n;
%%
% *The net contains the database of the UWSN networks:*
%%
% _In the form of Matlab matrixes with the node's X,Y coordinates._
net = [1:n;rand([1,n])*w;rand([1,n])*h];
net1 = net;
%%
% *You can choose radio range in meters:*
R = n/1.5;
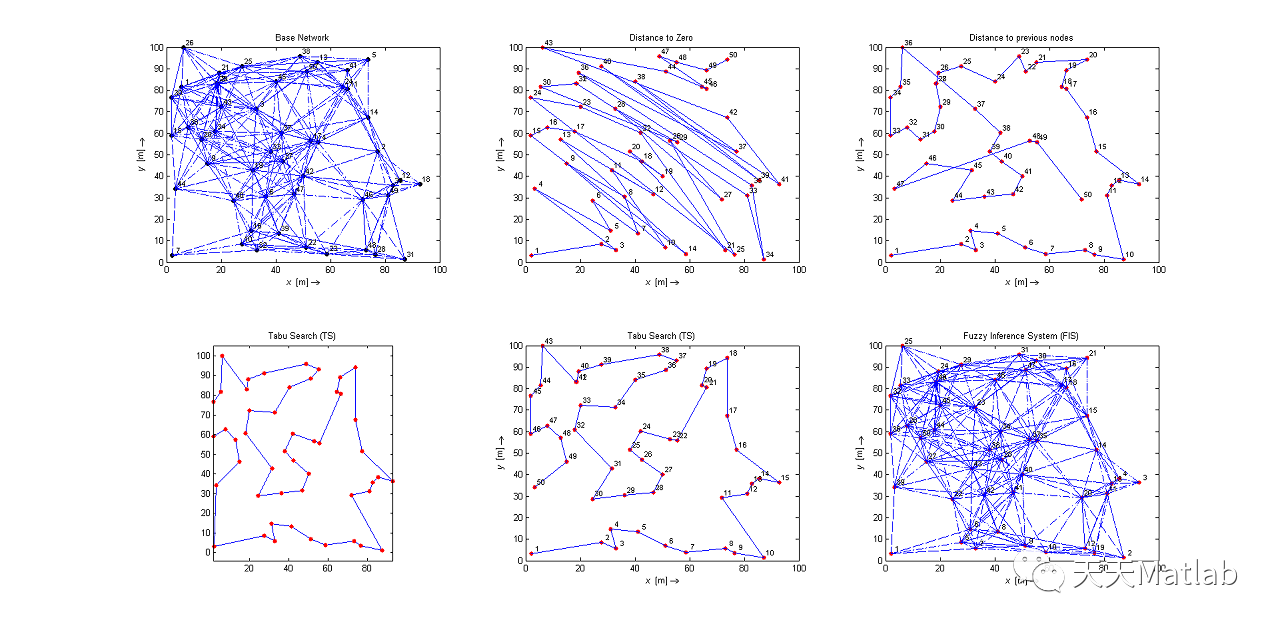
%% *Create figure graphics object1:*
%%
% _Loads a selected network model from the net and displays its layout_
% _into the figure._
subplot(231),plot(net(2,:),net(3,:),'ko','MarkerSize',5,'MarkerFaceColor','k');
title('Base Network');
xlabel('\it x \rm [m] \rightarrow');
ylabel('\it y \rm [m] \rightarrow');
hold on;
for i = 1:numel(net(1,:))
for j = 1:numel(net(1,:))
X1 = net(2,i);
Y1 = net(3,i);
X2 = net(2,j);
Y2 = net(3,j);
xSide = abs(X2-X1);
ySide = abs(Y2-Y1);
d = sqrt(xSide^2+ySide^2);
DD(:,i)=d;
if (d<R)&&(i~=j)
vertice1 = [X1,X2];
vertice2 = [Y1,Y2];
plot(vertice1,vertice2,'-.b','LineWidth',0.1);
hold on;
end
end
end
v = net(1,:)';
s = int2str(v);
text(net(2,:)+1,net(3,:)+1,s,'FontSize',8,'VerticalAlignment','Baseline');
Cost1=sum(DD);
%% *Create figure graphics object2:*
%%
% _Optimization UWSNs localization using an algorithm that calculate the_
% _distance of each nodes to Zero._
for i = 1:numel(net(1,:))
X1 = 0;
Y1 = 0;
X2 = net(2,i);
Y2 = net(3,i);
xSide = abs(X2-X1);
ySide = abs(Y2-Y1);
d(1,i) = sqrt(xSide^2+ySide^2);
end
net(4,:) = d(1,:);
[p,q] = sort(net(4,:));
net = net(:,q);
net(1,:) = 1:n;
subplot(232),plot(net(2,:),net(3,:),'r.','MarkerSize',15);
title('Distance to Zero');
xlabel('\it x \rm [m] \rightarrow')
ylabel('\it y \rm [m] \rightarrow')
hold on;
for i = 1:numel(net(1,:))-1
X1 = net(2,i);
Y1 = net(3,i);
X2 = net(2,i+1);
Y2 = net(3,i+1);
xSide = abs(X2-X1);
ySide = abs(Y2-Y1);
d = sqrt(xSide^2+ySide^2);
DD(:,i)=d;
vertice1 = [X1,X2];
vertice2 = [Y1,Y2];
plot(vertice1,vertice2,'b');
hold on;
end
v = net(1,:)';
s = int2str(v);
text(net(2,:)+1,net(3,:)+1,s,'FontSize',8,'VerticalAlignment','Baseline');
Cost2=sum(DD);
%% *Create figure graphics object3:*
%%
% _Optimization UWSNs localization using an algorithm that calculate_
% _distance of each nodes to previous nodes._
X1 = 0;
Y1 = 0;
not = [];
for i = 1:numel(net(1,:))
d = [];
for j = 1:numel(net(1,:))
X2 = net(2,j);
Y2 = net(3,j);
xSide = abs(X2-X1);
ySide = abs(Y2-Y1);
if(sqrt(xSide^2+ySide^2)~=0)
d(1,j) = sqrt(xSide^2+ySide^2);
end
end
min = d(1,1);
minj = 1;
for j = 1:numel(net(1,:))
if(min>d(1,j))
min = d(1,j);
minj = j;
end
end
not(:,i) = net(:,minj);
net(2,minj) = inf;
net(3,minj) = inf;
X1 = not(2,i);
Y1 = not(3,i);
end
not = [1:n;not(2,:);not(3,:)];
subplot(233),plot(not(2,:),not(3,:),'r.','MarkerSize',15);
title('Distance to previous nodes');
xlabel('\it x \rm [m] \rightarrow')
ylabel('\it y \rm [m] \rightarrow')
hold on;
for i = 1:numel(not(1,:))-1
X1 = not(2,i);
Y1 = not(3,i);
X2 = not(2,i+1);
Y2 = not(3,i+1);
xSide = abs(X2-X1);
ySide = abs(Y2-Y1);
d = sqrt(xSide^2+ySide^2);
DD(:,i)=d;
vertice1 = [X1,X2];
vertice2 = [Y1,Y2];
plot(vertice1,vertice2,'b');
hold on;
end
v = not(1,:)';
s = int2str(v);
text(not(2,:)+1,not(3,:)+1,s,'FontSize',8,'VerticalAlignment','Baseline');
Cost3=sum(DD);
%% *Create figure graphics object4,5:*
%%
% _Optimization UWSNs localization using Tabu search (TS) algorithm._
%%
% *Inputs Definition:*
pos = net1';
pos(:,1) = [];
x = pos(:,1);
y = pos(:,2);
n = numel(x);
D = zeros(n,n);
for i = 1:n-1
for j = i+1:n
D(i,j) = norm([x(i) y(i)]-[x(j) y(j)]);
D(j,i) = D(i,j);
end
end
model.n = n;
model.x = x;
model.y = y;
model.D = D;
CostFunction = @(tour) TourLength(tour,model.D); % cost function
nVar = model.n; % number of unknown variables
VarSize = [1 nVar]; % unknown variables matrix size
%%
% *TS Parameters:*
MaxIt = n;
Actions = CreateTSPActionList(nVar);
nActions = numel(Actions);
TL0 = round(0.5*nActions);
%%
% *Initialization:*
TL = zeros(size(Actions));
Sol.Position = randperm(nVar);
Sol.Cost = CostFunction(Sol.Position);
BestSol = Sol;
BestCost = zeros(MaxIt,1);
%%
% *Solution Plot:*
OnlinePlot = true;
if OnlinePlot
subplot(234),hPlots = PlotTour(model,BestSol.Position);
title('Tabu Search (TS)');
pause(0.001);
end
%%
% *TS Main Loop:*
for it = 1:MaxIt
BestNewSol.Position = [];
BestNewSol.Cost = inf;
BestAction = 0;
for k = 1:nActions
NewSol.Position = ApplyAction(Sol.Position,Actions{k});
NewSol.Cost = CostFunction(NewSol.Position);
% Aspiration Criterion
if TL(k)>0 && NewSol.Cost<BestSol.Cost
TL(k) = 0;
end
if TL(k)==0
if NewSol.Cost<BestNewSol.Cost
BestNewSol = NewSol;
BestAction = k;
end
end
end
TL = max(TL-1,0);
TL(BestAction) = TL0;
Sol = BestNewSol;
if Sol.Cost<BestSol.Cost
BestSol = Sol;
end
if OnlinePlot
UpdatePlot(hPlots,model,BestSol.Position);
pause(0.001);
end
BestCost(it) = BestSol.Cost;
end
%%
% *Results:*
net = BestSol.Position;
for i = 1:numel(net1(1,:))
for j = 1:numel(net1(1,:))
if net(1,i)==net1(1,j)
net(2,i) = net1(2,j);
net(3,i) = net1(3,j);
end
end
end
for i = 1:numel(net(1,:))
X1 = 0;
Y1 = 0;
X2 = net(2,i);
Y2 = net(3,i);
xSide = abs(X2-X1);
ySide = abs(Y2-Y1);
d(1,i) = sqrt(xSide^2+ySide^2);
end
net(4,:) = d(1,:);
[p,q] = sort(net(4,:));
z = q(1);
net2 = circshift(net,[0,numel(net(1,:))+1-z]);
net = net2;
net(1,:) = 1:n;
subplot(235),plot(net(2,:),net(3,:),'r.','MarkerSize',15);
title('Tabu Search (TS)');
xlabel('\it x \rm [m] \rightarrow')
ylabel('\it y \rm [m] \rightarrow')
Cost3=Cost3+100;
hold on;
for i = 1:numel(net(1,:))-1
X1 = net(2,i);
Y1 = net(3,i);
X2 = net(2,i+1);
Y2 = net(3,i+1);
xSide = abs(X2-X1);
ySide = abs(Y2-Y1);
d = sqrt(xSide^2+ySide^2);
vertice1 = [X1,X2];
vertice2 = [Y1,Y2];
plot(vertice1,vertice2,'b');
hold on;
end
v = net(1,:)';
s = int2str(v);
text(net(2,:)+1,net(3,:)+1,s,'FontSize',8,'VerticalAlignment','Baseline');
%% *The Degree of each node:*
%%
% _The degree of each node is the number of connection of each node by_
% _other nodes._
Degree=[];
for i = 1:numel(net(1,:))
Degree(i)=0;
for j = 1:numel(net(1,:))
X1 = net(2,i);
Y1 = net(3,i);
X2 = net(2,j);
Y2 = net(3,j);
xSide = abs(X2-X1);
ySide = abs(Y2-Y1);
d = sqrt(xSide^2+ySide^2);
if (d<R)&&(i~=j)
Degree(i)= Degree(i)+1;
end
end
end
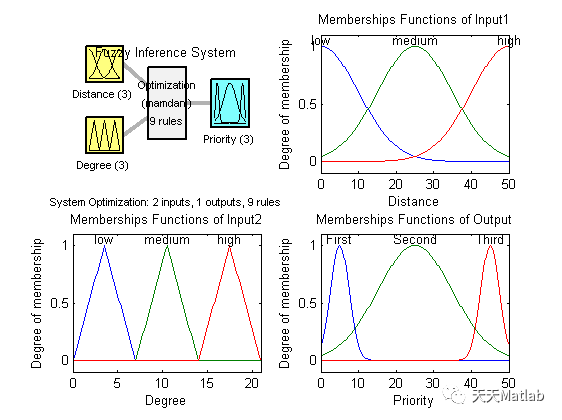
%% *Create figure graphics object6:*
%%
% _Optimization UWSNs localization using Fuzzy Inference System (FIS)._
fisName = 'Optimization';
fisType = 'mamdani';
input = 2;
output = 1;
andMethod = 'min';
orMethod = 'max';
impMethod = 'min';
aggMethod = 'max';
defuzzMethod = 'centroid';
a = newfis(fisName,fisType,andMethod,orMethod,...
impMethod,aggMethod,defuzzMethod);
a = addvar(a,'input','Distance',[0 n]);
a = addmf(a,'input',1,'low','gaussmf',[n/5 0]);
a = addmf(a,'input',1,'medium','gaussmf',[n/5 n/2]);
a = addmf(a,'input',1,'high','gaussmf',[n/5 n]);
mD = max(Degree);
a = addvar(a,'input','Degree',[0 mD]);
a = addmf(a,'input',2,'low','trimf',[0 mD/6 mD/3]);
a = addmf(a,'input',2,'medium','trimf',[mD/3 mD/2 mD*2/3]);
a = addmf(a,'input',2,'high','trimf',[mD*2/3 mD*2.5/3 mD]);
a = addvar(a,'output','Priority',[0 n]);
a = addmf(a,'output',1,'First','gaussmf',[n/20 n/10]);
a = addmf(a,'output',1,'Second','gaussmf',[n/5 n/2]);
a = addmf(a,'output',1,'Third','gaussmf',[n/20 n-n/10]);
ruleList=[
1 1 1 1 1
1 2 1 1 1
1 3 2 1 1
2 1 1 1 1
2 2 2 1 1
2 3 3 1 1
3 1 2 1 1
3 2 3 1 1
3 3 3 1 1];
a = addrule(a,ruleList);
writefis(a,'Optimization');
Inputs = [net(1,:)' Degree(1,:)'];
Fuzzy = readfis('Optimization');
Evaluation = evalfis(Inputs,Fuzzy);
Outputs = [net(1,:)' net(2,:)' net(3,:)' Evaluation];
[p,q] = sort(Outputs(:,4));
Outputs = Outputs(q,:);
Outputs(:,1) = 1:n;
Outputs = Outputs';
subplot(236),plot(Outputs(2,:),Outputs(3,:),'r.','MarkerSize',15);
title('Fuzzy Inference System (FIS)');
xlabel('\it x \rm [m] \rightarrow')
ylabel('\it y \rm [m] \rightarrow')
hold on;
for i = 1:numel(net(1,:))
for j = 1:numel(net(1,:))
X1 = net(2,i);
Y1 = net(3,i);
X2 = net(2,j);
Y2 = net(3,j);
xSide = abs(X2-X1);
ySide = abs(Y2-Y1);
d = sqrt(xSide^2+ySide^2);
if (d<R)&&(i~=j)
vertice1 = [X1,X2];
vertice2 = [Y1,Y2];
plot(vertice1,vertice2,'-.b','LineWidth',0.1);
hold on;
end
end
end
v = Outputs(1,:)';
s = int2str(v);
text(Outputs(2,:)+1,Outputs(3,:)+1,s,'FontSize',8,'VerticalAlignment','Baseline');
figure
subplot(221),plotfis(Fuzzy);
title('Fuzzy Inference System');
subplot(222),plotmf(Fuzzy,'input',1);
title('Memberships Functions of Input1');
subplot(223),plotmf(Fuzzy,'input',2);
title('Memberships Functions of Input2');
subplot(224),plotmf(Fuzzy,'output',1);
title('Memberships Functions of Output');
ruleview(Fuzzy);
surfview(Fuzzy);
Cost4=BestCost';
%% *Create figure graphics object7:*
%%
% _Cost of each type of optimization methods._
TotalCost=[Cost1,Cost2,Cost3,Cost4];
disp(['Cost of Default Network: ' num2str(Cost1)]);
disp(['Cost of Distance of Each Nodes to Zero: ' num2str(Cost2)]);
disp(['Cost of Distance of Each Nodes to Previous Nodes: ' num2str(Cost3)]);
disp(['Cost of Fuzzy Inference System: ' num2str(BestCost(n))]);
figure
plot(TotalCost,'-.r','LineWidth',2)
xlabel('Type of Optimization')
ylabel('Distance (m)')
title('Cost of Optimization Methods')
annotation('textbox',...
[0.5 0.6 0.3 0.3],...
'VerticalAlignment','middle',...
'String',{...
['\fontsize{20}\oplus \fontsize{10}Cost of Default Network = ',num2str(Cost1)],...
['\fontsize{20}\oslash \fontsize{10}Cost of Distance of Each Nodes to Zero = ',num2str(Cost2)],...
['\fontsize{20}\otimes \fontsize{10}Cost of Distance of Each Nodes to Previous Nodes = ',num2str(Cost3)],...
['\fontsize{20}\copyright \fontsize{10}Cost of Fuzzy Inference System = ',num2str(BestCost(n))]},...
'LineStyle',':',...
'LineWidth',2,...
'FitBoxToText','on',...
'BackgroundColor',[1 1 1]);
text(1,Cost1,'\fontsize{20}\color{black}\oplus',...
'HorizontalAlignment','center')
text(2,Cost2,'\fontsize{20}\color{black}\oslash',...
'HorizontalAlignment','center')
text(3,Cost3,'\fontsize{20}\color{black}\otimes',...
'HorizontalAlignment','center')
text(n+3,BestCost(n),'\fontsize{20}\color{black}\copyright',...
'HorizontalAlignment','center')
⛄ 运行结果
⛄ 参考文献
[1]常铁原, 刘伟娜, 张炎,等. 基于簇头距离和能量的优化LEACH协议[J]. 河北大学学报:自然科学版, 2019(2):7.
⛄ 完整代码
❤️部分理论引用网络文献,若有侵权联系博主删除
❤️ 关注我领取海量matlab电子书和数学建模资料


 235
235

 被折叠的 条评论
为什么被折叠?
被折叠的 条评论
为什么被折叠?
 到【灌水乐园】发言


