


 本文介绍了JMeter性能测试中的关键图表模块OverTime、Throughput和ResponseTimes,包括ResponsetimesOverTime、LatenciesOverTime等,帮助开发者识别性能瓶颈并进行容量规划。
=============================================
转载:https://www.cnblogs.com/poloyy/p/13280899.html
Charts 介绍
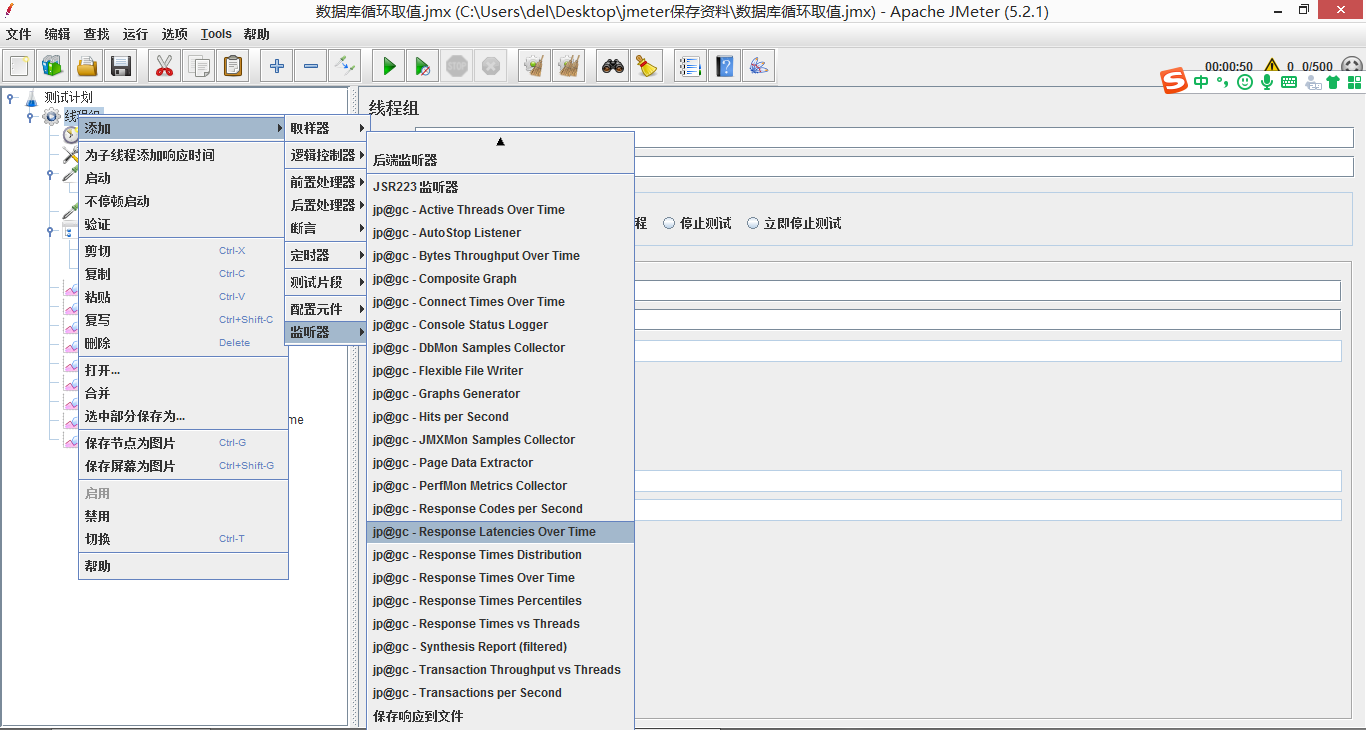
- 包含了各种详细信息图表,比 GUI 模式的图表好看且易懂多了!
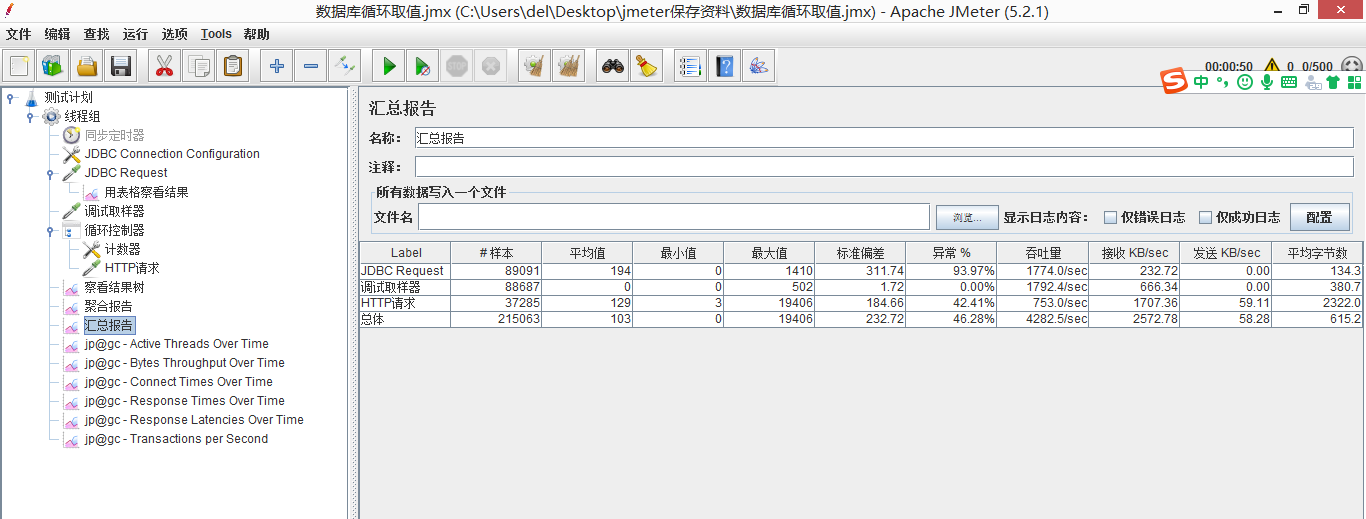
- 做性能测试,如何发现是否有性能瓶颈?必须从结果图表中找到鸭!
- 而 html 报告将性能测试可能需要用到的图表都加进去了,可谓是6666
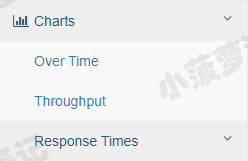
一共有三大模块
- Over Time
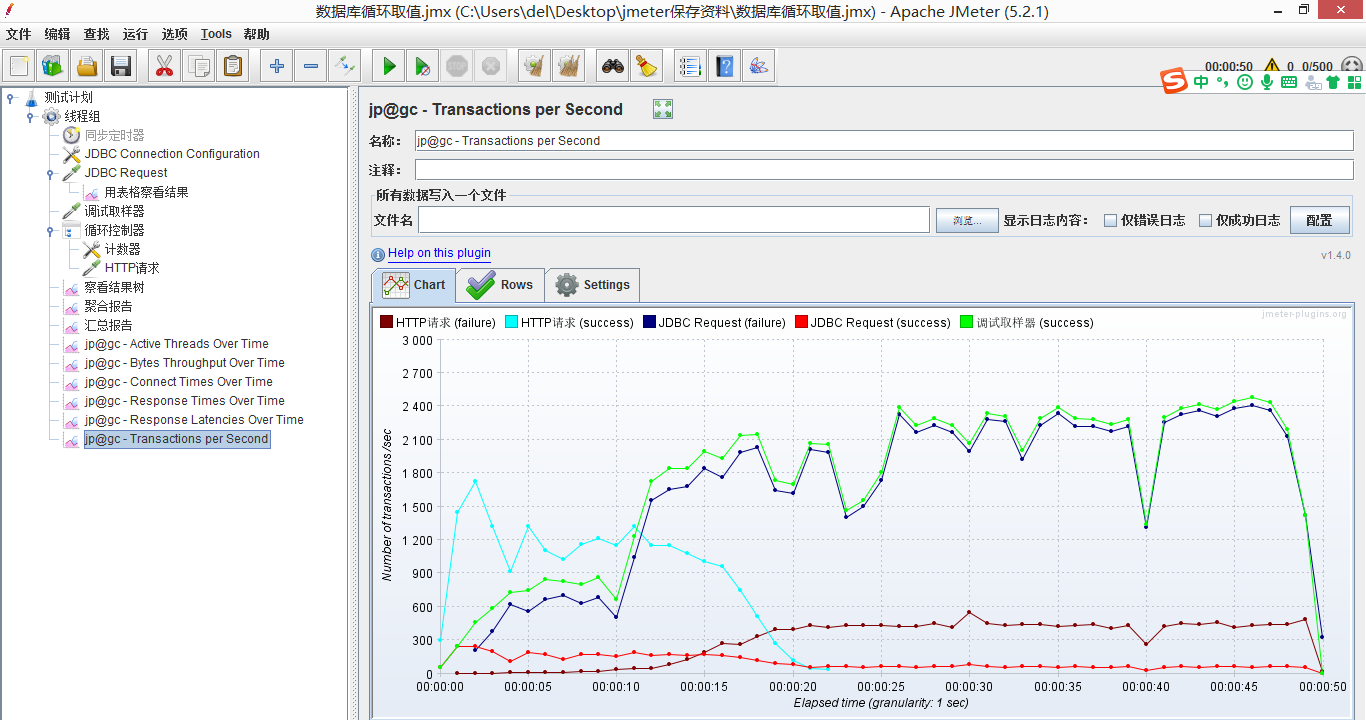
- Throughput
- Response Times
Over Time
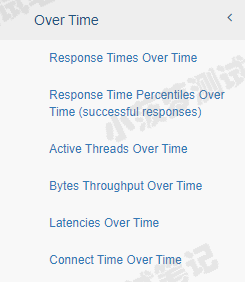
一共有 6 个图表
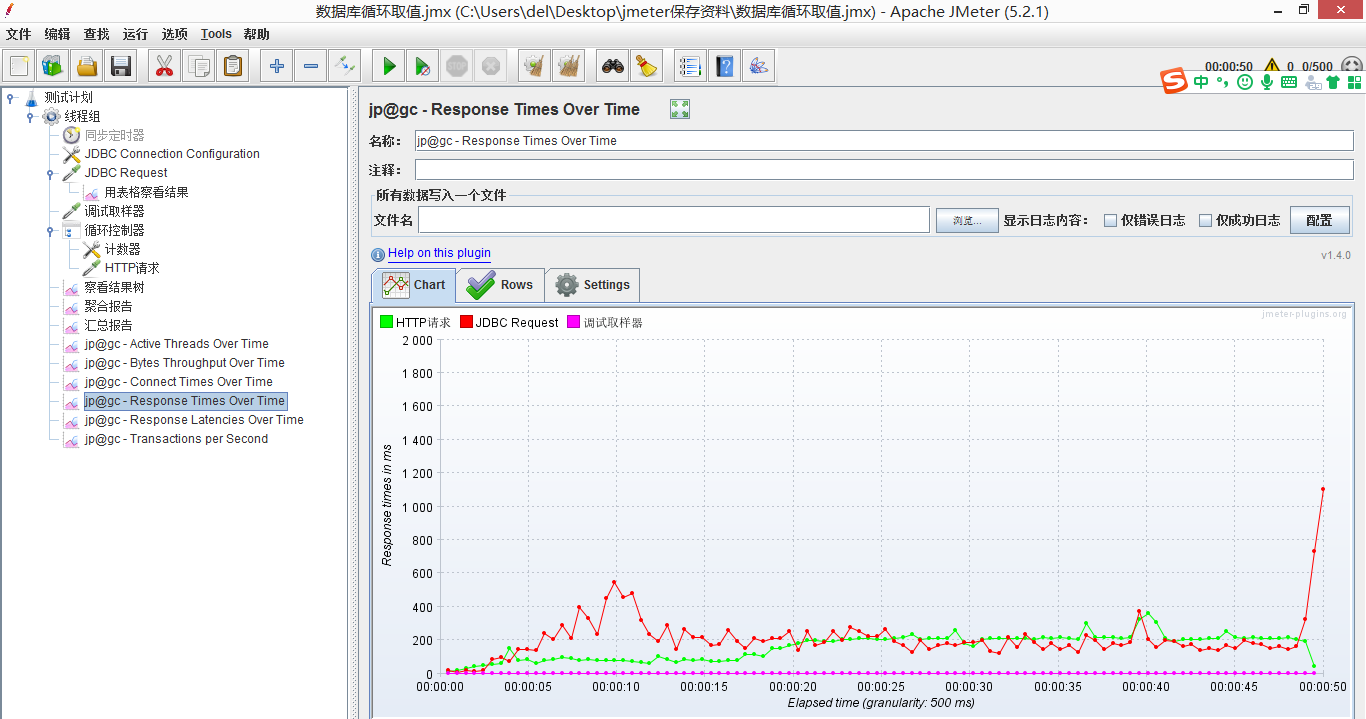
- Response times Over Time
- Response times Percentiles Over Time
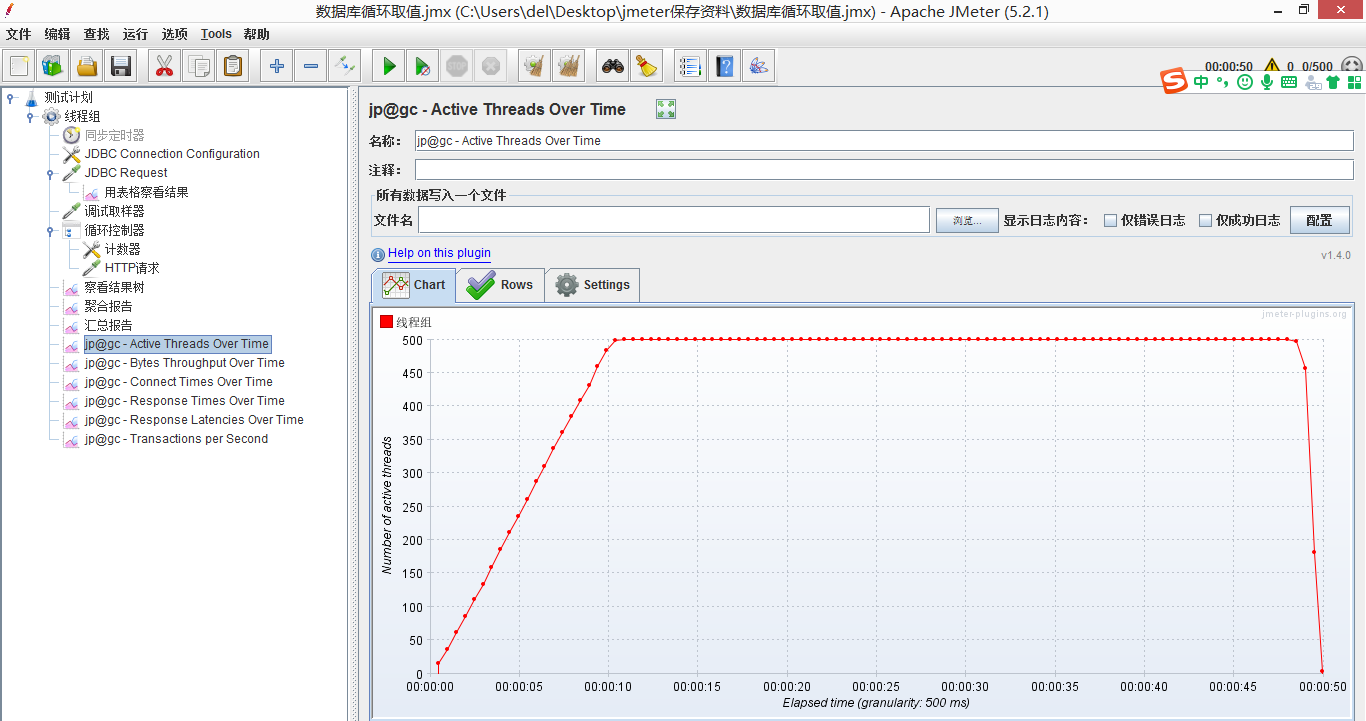
- Active Threads Over Time
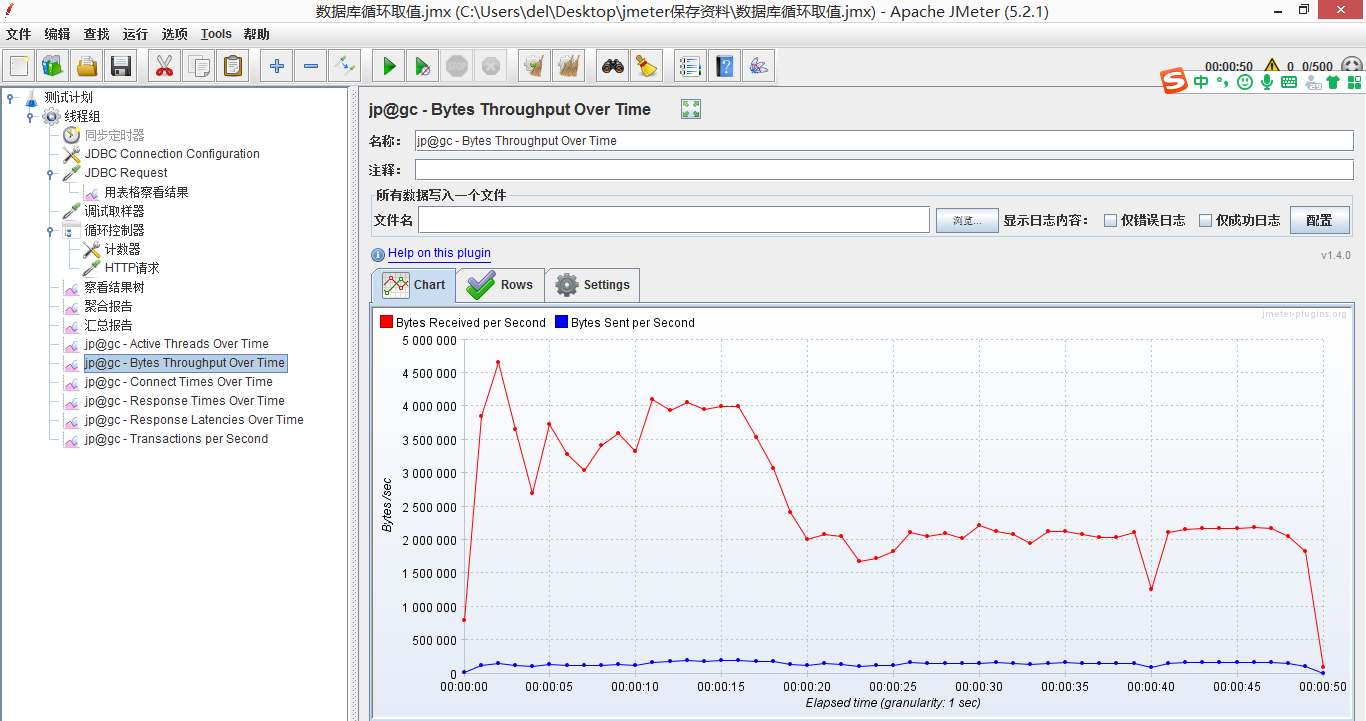
- Bytes throughput Over Time
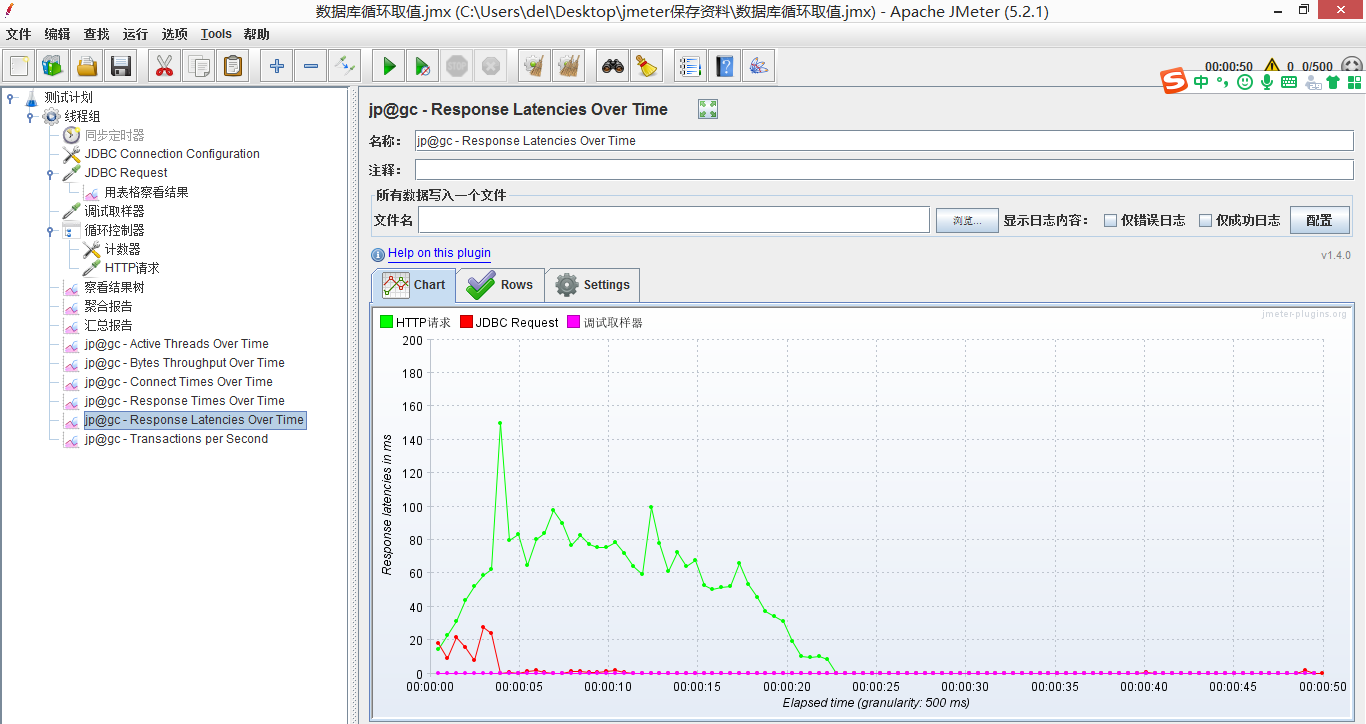
- Latencies Over Time
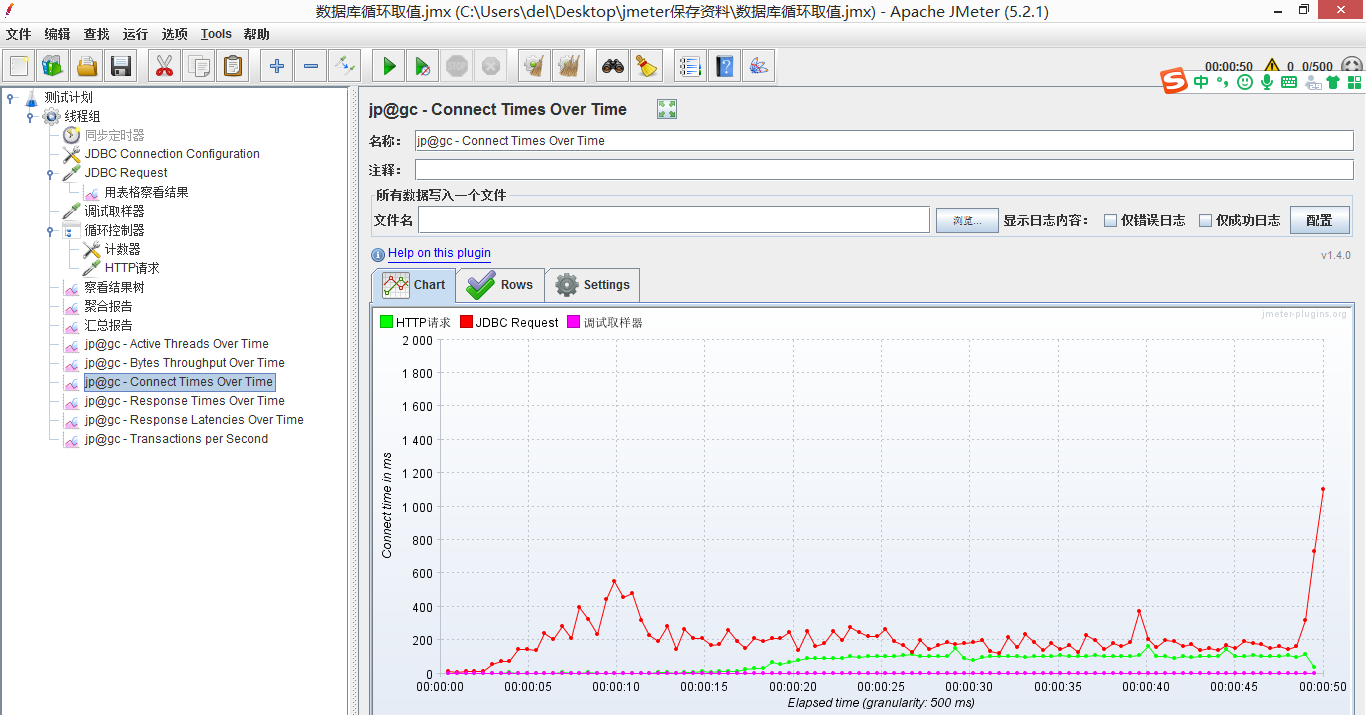
- Connect Time Over Time
=======>>>> 点击右侧即可跳转对应图表哦
 最低0.47元/天 解锁文章


 2468
2468

 被折叠的 条评论
为什么被折叠?
被折叠的 条评论
为什么被折叠?
 到【灌水乐园】发言


