


 本文通过一个具体的MATLAB代码示例,展示了如何使用MATLAB进行基本的绘图操作,包括定义变量范围、绘制不同类型的函数图形、设置坐标轴范围、添加图例以及使用鼠标标记特定位置等。
例子:
clear % clear the all variable of the workspace
t = [0 : pi/12 : 4*pi]; % definate the range of variable t
hold on % pain the diffrent function
axis([0 4*pi -10 10]); % set the axies xlabe range and ylable range
plot(t, 10*sin(t),'r+:');
plot(t,5*cos(t),'b*--');
xlabel('Time t');
ylabel('Value');
title('The simple draw examples ');
legend('sin(x)','cos(x)');
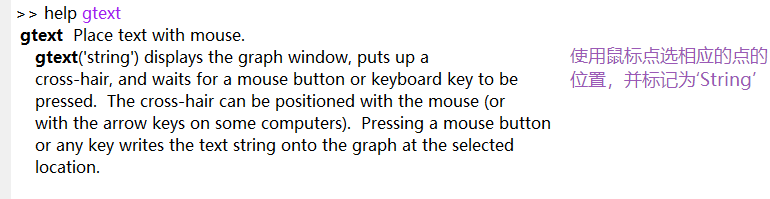
gtext('x1'); % mark the x1 position use mouse
gtext('x2');
grid on
实验的数据:


 3万+
3万+

 被折叠的 条评论
为什么被折叠?
被折叠的 条评论
为什么被折叠?
 到【灌水乐园】发言


