


 本文通过一个具体的例子展示了如何使用Matplotlib库来绘制散点图,并详细介绍了设置图表样式、添加标签以及调整刻度的方法。
基本演示
与折线图一样的 折线图
使用 plot.scatter(x, y)
from matplotlib import pyplot as plt
import matplotlib
font = {'family': 'MicroSoft Yahei',
'weight': 'bold',
'size': '10'}
matplotlib.rc('font', **font)
plt.figure(figsize=(20, 8), dpi=80)
x_3 = range(1, 32)
x_10 = range(41, 72)
y_3 = [11, 17, 16, 11, 12, 11, 12, 6, 6, 7, 8, 9, 12, 15, 14, 17, 18, 21, 16, 17, 20, 14, 15, 15, 15, 19, 21, 22, 22,
22,
23]
y_10 = [26, 26, 28, 19, 21, 17, 16, 19, 18, 20, 20, 19, 22, 23, 17, 20, 21, 20, 22, 15, 11, 15, 5, 13, 17, 10, 11, 13,
12,
3, 6]
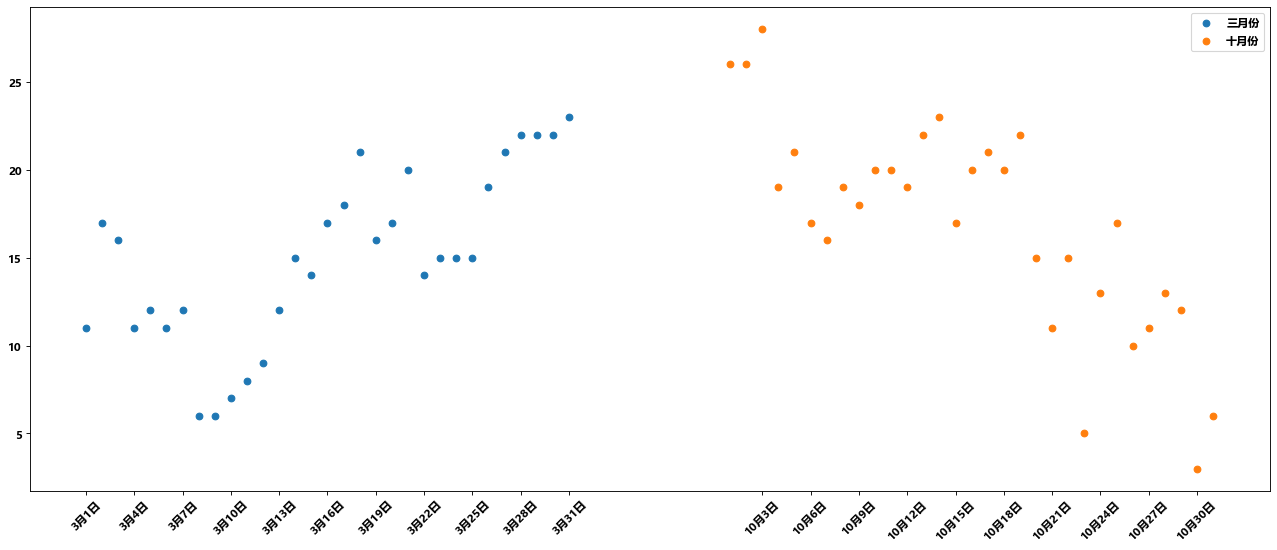
plt.scatter(x_3, y_3, label="三月份")
plt.scatter(x_10, y_10, label="十月份")
# 设置 刻度
_x = list(x_3) + list(x_10)
_xticks = ["3月{}日".format(i) for i in x_3]
_xticks += ["10月{}日".format(i - 40) for i in x_10]
plt.xticks(_x[::3], _xticks[::3], rotation=45)
plt.legend(loc="best")
plt.show()


 2933
2933

 被折叠的 条评论
为什么被折叠?
被折叠的 条评论
为什么被折叠?
 到【灌水乐园】发言


