highcharts数据series data多值绑定

这段代码演示了如何使用Highcharts库创建柱状图,以展示不同级别的医院(三级、二级、专科)的接入量数据。通过定义颜色和数值,展示了30、40和50三个级别的接入值。

摘要生成于 C知道 ,由 DeepSeek-R1 满血版支持, 前往体验 >


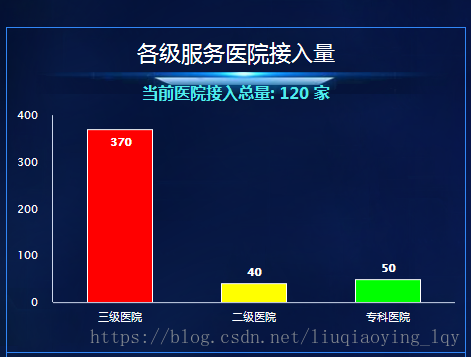
    //各级服务医院接入量(2级、3级、专科医院接入量)
        $(function () {
            var vardata = [];
            var col = "";
            var val = 0;   

var categories = [];
            categories.push('三级医院');
            categories.push('二级医院');
            categories.push('专科医院');


            for (var i = 0; i < 3; i++) {
                var data = [];
                if (i==0) {
                    col = 'red';
                    val = 370;
                } else if (i==1) {
                    col = 'yellow';
                    val = 40;
                } else if (i==2) {
                    col = '#00FF00';
                    val = 50;
                }

                var item = {
                    //name:i+'级',
                    color:col,
                    y: val
                }
                vardata.push(item);
            }
            //[{
            //    name: '三级',
            //    color: 'red',
            //    y: 30
            //}, {
            //    name: '二级',
            //    color: 'yellow',
            //    y: 40
            //}, {
            //    name: '专科',
            //    color: '#00FF00',
            //    y: 50
            //}],


            $('#container1').highcharts({
                chart: {
                    type: 'column',
                    backgroundColor: 'rgba(0,0,0,0)',
                },
                title: {
                    text: ''
                },
                subtitle: {
                    text: ''
                },
                xAxis: {
                    categories:categories,// ['三级医院', '二级医院', '专科医院', ],
                    labels: {
                        overflow: 'justify',
                        style: {
                            color: '#fff', //颜色
                        }
                    },
                    gridLineWidth: 0,
                    tickWidth: 0,
                    lineWidth: 1,
                    crosshair: true
                },
                yAxis: {
                    min: 0,
                    title: {
                        text: ''
                    },
                    labels: {
                        overflow: 'justify',
                        style: {
                            color: '#fff', //颜色
                        }
                    },
                    gridLineWidth: 0,
                    tickWidth: 0,
                    lineWidth: 1
                },
                tooltip: {
                    headerFormat: '<span style="font-size:10px">{point.key}</span><table>',
                    pointFormat: '<tr><td style="color:{series.color};padding:0">{series.name}: </td>' + '<td style="padding:0"><b>{point.y:.1f}</b></td></tr>',
                    footerFormat: '</table>',
                    shared: true,
                    useHTML: true
                },
                plotOptions: {
                    column: {
                        dataLabels: {
                            enabled: true, // dataLabels设为true
                            style: {
                                color: '#fff'
                            }
                        }
                    }
                },
                legend: {
                    enabled: false,
                    itemStyle: {
                        'fontSize': '16px',
                        'color': '#fff'
                    }
                },
                series: [{
                    data:
                        vardata,
                    //    [{
                    //    name: '三级',
                    //    color: 'red',
                    //    y: 30
                    //}, {
                    //    name: '二级',
                    //    color: 'yellow',
                    //    y: 40
                    //}, {
                    //    name: '专科',
                    //    color: '#00FF00',
                    //    y: 50
                    //}],
                }]
            });
        });


评论
添加红包

请填写红包祝福语或标题

红包个数最小为10个

红包金额最低5元

当前余额3.43前往充值 >
需支付:10.00
成就一亿技术人!
领取后你会自动成为博主和红包主的粉丝 规则
hope_wisdom
发出的红包
实付
使用余额支付
点击重新获取
扫码支付
钱包余额 0

抵扣说明:

1.余额是钱包充值的虚拟货币,按照1:1的比例进行支付金额的抵扣。
2.余额无法直接购买下载,可以购买VIP、付费专栏及课程。

余额充值