import chardet
import streamlit as st
import pandas as pd
import numpy as np
import joblib
import os
import time
import matplotlib.pyplot as plt
import seaborn as sns
from pyspark.sql import SparkSession
from pyspark.ml.feature import VectorAssembler, StandardScaler
from pyspark.ml.classification import LogisticRegression, DecisionTreeClassifier, RandomForestClassifier
from pyspark.ml.evaluation import BinaryClassificationEvaluator
from pyspark.ml.tuning import ParamGridBuilder, CrossValidator
from sklearn.metrics import classification_report, confusion_matrix
import warnings
import dask.dataframe as dd
from dask.diagnostics import ProgressBar
from dask_ml.preprocessing import StandardScaler as DaskStandardScaler
import tempfile
import shutil
import re
warnings.filterwarnings("ignore")
plt.rcParams['font.sans-serif'] = ['SimHei']
plt.rcParams['axes.unicode_minus'] = False
# 页面设置
st.set_page_config(
page_title="单宽转融用户预测系统",
page_icon="📶",
layout="wide",
initial_sidebar_state="expanded"
)
# 自定义CSS样式
st.markdown("""
<style>
.stApp {
background: linear-gradient(135deg, #f5f7fa 0%, #e4edf5 100%);
font-family: 'Helvetica Neue', Arial, sans-serif;
}
.header {
background: linear-gradient(90deg, #2c3e50 0%, #4a6491 100%);
color: white;
padding: 1.5rem;
border-radius: 0.75rem;
box-shadow: 极 4px 12px rgba(0,0,0,0.1);
margin-bottom: 2rem;
}
.card {
background: white;
border-radius: 0.75rem;
padding: 1.5rem;
margin-bottom: 1.5rem;
box-shadow: 0 4px 12px rgba(0,0,0,0.08);
transition: transform 0.3s ease;
}
.card:hover {
transform: translateY(-5px);
box-shadow: 0 6px 16px rgba(0,0,0,0.12);
}
.stButton button {
background: linear-gradient(90deg, #3498db 0%, #1a5276 100%) !important;
color: white !important;
border: none !important;
border-radius: 0.5rem;
padding: 0.75rem 1.5rem;
font-size: 1rem;
font-weight: 600;
transition: all 0.3s ease;
width: 100%;
}
.stButton button:hover {
transform: scale(1.05);
box-shadow: 0 4px 8px rgba(52, 152, 219, 0.4);
}
.feature-box {
background: linear-gradient(135deg, #e3f2fd 0%, #bbdefb 100%);
border-radius: 0.75rem;
padding: 1.5rem;
margin-bottom: 1.5rem;
}
.result-box {
background: linear-gradient(135deg, #e8f5e9 0%, #c8e6c9 100%);
border-radius: 0.75rem;
padding: 1.5rem;
margin-top: 1.5rem;
}
.model-box {
background: linear-gradient(135deg, #fff3e0 0%, #ffe0b2 100%);
border-radius: 0.75rem;
padding: 1.5rem;
margin-top: 1.5rem;
}
.stProgress > div > div > div {
background: linear-gradient(90deg, #2ecc71 0%, #27ae60 100%) !important;
}
.metric-card {
background: white;
border-radius: 0.75rem;
padding: 1rem;
text-align: center;
box-shadow: 0 4px 8px rgba(0,0,0,0.06);
}
.metric-value {
font-size: 1.8rem;
font-weight: 700;
color: #2c3e50;
}
.metric-label {
font-size: 0.9rem;
color: #7极8c8d;
margin-top: 0.5rem;
}
.highlight {
background: linear-gradient(90deg, #ffeb3b 0%, #fbc02d 100%);
padding: 0.2rem 0.5rem;
border-radius: 0.25极;
font-weight: 600;
}
.stDataFrame {
border-radius: 0.75rem;
box-shadow: 0 4px 8px rgba(0,0,0,0.06);
}
.risk-high {
background-color: #ffcdd2 !important;
color: #c62828 !important;
font-weight: 700;
}
.risk-medium {
background-color: #fff9c4 !important;
color: #f57f17 !important;
font-weight: 600;
}
.risk-low {
background-color: #c8e6c9 !important;
color: #388e3c !important;
}
</style>
""", unsafe_allow_html=True)
def clean_numeric_string(value):
"""清理数值字符串中的非数字字符"""
if pd.isna(value):
return np.nan
try:
# 尝试直接转换为浮点数
return float(value)
except (ValueError, TypeError):
# 移除非数字字符(除小数点和负号外)
cleaned = re.sub(r'[^\d\.-]', '', str(value))
try:
return float(cleaned) if cleaned else np.nan
except ValueError:
return np.nan
def is_numeric_column(series):
"""检测列是否可以转换为数值类型"""
try:
# 获取前1000行作为样本
if isinstance(series, dd.Series):
sample = series.head(1000) # Dask Series 的 head() 返回 Pandas Series
else:
sample = series.head(1000) # Pandas Series 的 head() 返回 Pandas Series
# 尝试转换为数值类型
pd.to_numeric(sample, errors='raise')
return True
except (ValueError, TypeError):
return False
def preprocess_data(ddf):
"""使用Dask进行大数据预处理"""
processed_ddf = ddf.copy()
# 删除无意义特征
drop_cols = ['BIL_MONTH', 'ASSET_ROW_ID', 'CCUST_ROW_ID', 'BELONG_CITY',
'MKT_CHANNEL_NAME', 'MKT_CHANNEL_SUB_NAME', 'PREPARE_FLG',
'SERV_START_DT', 'COMB_STAT_NAME', 'FIBER_ACCESS_CATEGORY']
existing_cols = [col for col in drop_cols if col in processed_ddf.columns]
processed_ddf = processed_ddf.drop(columns=existing_cols)
# 初始数值列
initial_numeric_cols = processed_ddf.select_dtypes(include=[np.number]).columns.tolist()
if 'is_rh_next' in initial_numeric_cols:
initial_numeric_cols.remove('is_rh_next')
# 潜在数值列
potential_numeric_cols = [
'MAX_PRICE_COMPANY', 'MAX_PRICE_MODEL', 'MAX_PRICE_TERM_TYPE',
'MOBLE_4G_CNT_LV', 'MOBLE_CNT_LV', 'OWE_AMT_LV', 'OWE_CNT_LV',
'PROM_INTEG_ID', 'TOUSU_CNT_LV'
]
# 数值列集合
numeric_cols = initial_numeric_cols.copy()
# 处理潜在数值列
for col in potential_numeric_cols:
if col in processed_ddf.columns:
# 检查列是否可转换为数值型
if is_numeric_column(processed_ddf[col]):
try:
# 尝试转换为数值型
processed_ddf[col] = processed_ddf[col].apply(clean_numeric_string, meta=(col, 'f8'))
numeric_cols.append(col)
except Exception as e:
st.warning(f"列 {col} 转换为数值型失败: {str(e)},将视为分类特征")
else:
st.warning(f"列 {col} 包含非数值数据,将视为分类特征")
# 处理缺失值
with ProgressBar():
# 计算数值列均值
means = processed_ddf[numeric_cols].mean().compute()
# 填充数值列缺失值
for col in numeric_cols:
processed_ddf[col] = processed_ddf[col].fillna(means[col])
# 处理非数值列缺失值
non_numeric_cols = [col for col in processed_ddf.columns if col not in numeric_cols and col != 'is_rh_next']
for col in non_numeric_cols:
processed_ddf[col] = processed_ddf[col].fillna("Unknown")
# 类型转换
for col in numeric_cols:
if processed_ddf[col].dtype == 'float64':
# 检查是否可以安全转换为整数
try:
# 使用采样数据代替整个数据集
sample = processed_ddf[col].dropna().head(1000) # 返回Pandas Series
if (sample == sample.astype(int)).all():
processed_ddf[col] = processed_ddf[col].astype('int64')
except:
# 如果转换失败,保持浮点类型
pass
# 二进制特征编码
binary_cols = ['IF_YHTS', 'is_kdts', 'is_itv_up', 'is_mobile_up', 'if_zzzw_up']
for col in binary_cols:
if col in processed_ddf.columns:
processed_ddf[col] = processed_ddf[col].map({'否': 0, '是': 1, 0: 0, 1: 1, 'Unknown': -1},
meta=(col, 'int64'))
# 分类特征编码
if 'GENDER' in processed_ddf.columns:
gender_mapping = {'男': 0, '女': 1, 'Unknown': -1}
processed_ddf['GENDER'] = processed_ddf['GENDER'].map(gender_mapping, meta=('GENDER', 'int64'))
if 'MKT_STAR_GRADE_NAME' in processed_ddf.columns:
star_mapping = {'五星级': 5, '四星级': 4, '三星级': 3, '二星级': 2, '一星级': 1, 'Unknown': 0}
processed_ddf['MKT_STAR_GRADE_NAME'] = processed_ddf['MKT_STAR_GRADE_NAME'].map(star_mapping,
meta=('MKT_STAR_GRADE_NAME', 'int64'))
# 特征工程
if 'PROM_AMT' in numeric_cols and 'STMT_AMT' in numeric_cols:
processed_ddf['CONSUMPTION_RATIO'] = processed_ddf['PROM_AMT'] / (processed_ddf['STMT_AMT'] + 1)
numeric_cols.append('CONSUMPTION_RATIO')
if 'DWN_VOL' in numeric_cols and 'ONLINE_DAY' in numeric_cols:
processed_ddf['TRAFFIC_DENSITY'] = processed_ddf['DWN_VOL'] / (processed_ddf['ONLINE_DAY'] + 1)
numeric_cols.append('TRAFFIC_DENSITY')
if 'TERM_CNT' in processed_ddf.columns:
processed_ddf['HAS_TERMINAL'] = (processed_ddf['TERM_CNT'] > 0).astype('int64')
numeric_cols.append('HAS_TERMINAL')
# 标准化处理
scaler = DaskStandardScaler()
numeric_cols_for_scaling = [col for col in numeric_cols if col != 'is_rh_next']
if numeric_cols_for_scaling:
processed_ddf[numeric_cols_for_scaling] = scaler.fit_transform(processed_ddf[numeric_cols_for_scaling])
feature_cols = [col for col in processed_ddf.columns if col != 'is_rh_next']
return processed_ddf, feature_cols, means, numeric_cols_for_scaling, scaler
def create_spark_session():
"""创建或获取现有的Spark会话"""
return SparkSession.builder \
.appName("SingleToMeltUserPrediction") \
.config("spark.sql.shuffle.partitions", "8") \
.config("spark.driver.memory", "8g") \
.config("spark.executor.memory", "8g") \
.getOrCreate()
def train_models(spark_df, feature_cols):
"""使用Spark训练多个模型并评估性能"""
spark = create_spark_session()
assembler = VectorAssembler(inputCols=feature_cols, outputCol="rawFeatures")
assembled_df = assembler.transform(spark_df)
scaler = StandardScaler(inputCol="rawFeatures", outputCol="features")
scaler_model = scaler.fit(assembled_df)
scaled_df = scaler_model.transform(assembled_df)
train_df, test_df = scaled_df.randomSplit([0.8, 0.2], seed=42)
# 定义模型和参数网格
models = {
"逻辑回归": (
LogisticRegression(featuresCol="features", labelCol="is_rh_next"),
ParamGridBuilder().addGrid(LogisticRegression.regParam, [0.01, 0.1])
.addGrid(LogisticRegression.elasticNetParam, [0.0, 0.5])
.build()
),
"决策树": (
DecisionTreeClassifier(featuresCol="features", labelCol="is_rh_next"),
ParamGridBuilder().addGrid(DecisionTreeClassifier.maxDepth, [5, 10])
.addGrid(DecisionTreeClassifier.minInstancesPerNode, [10, 20])
.build()
),
"随机森林": (
RandomForestClassifier(featuresCol="features", labelCol="is_rh_next", numTrees=10),
ParamGridBuilder().addGrid(RandomForestClassifier.numTrees, [10, 20])
.addGrid(RandomForestClassifier.maxDepth, [5, 10])
.build()
)
}
evaluator = BinaryClassificationEvaluator(labelCol="is_rh_next", metricName="areaUnderROC")
results = {}
for model_name, (model, param_grid) in models.items():
with st.spinner(f"正在训练{model_name}模型..."):
cv = CrossValidator(estimator=model,
estimatorParamMaps=param_grid,
evaluator=evaluator,
numFolds=3)
cv_model = cv.fit(train_df)
predictions = cv_model.transform(test_df)
auc = evaluator.evaluate(predictions)
accuracy = predictions.filter(predictions.is_rh_next == predictions.prediction).count() / test_df.count()
results[model_name] = {
"model": cv_model,
"auc": auc,
"accuracy": accuracy,
"best_params": cv_model.bestModel._java_obj.parent().extractParamMap(),
"feature_importances": getattr(cv_model.bestModel, "featureImportances", {}).toArray().tolist() if model_name != "逻辑回归" else None
}
return results
# 页面布局
st.markdown("""
<div class="header">
<h1 style='text-align: center; margin: 0;'>单宽转融用户预测系统</h1>
<p style='text-align: center; margin: 0.5rem 0 0; font-size: 1.1rem;'>基于大数据挖掘的精准营销分析平台</p>
</div>
""", unsafe_allow_html=True)
col1, col2 = st.columns([1, 1.5])
with col1:
st.markdown("""
<div class="feature-box">
<h4>📈 系统功能</h4>
<ul>
<li>用户转化预测</li>
<li>多模型对比分析</li>
<li>特征重要性分析</li>
<li>可视化数据洞察</li>
</ul>
</div>
""", unsafe_allow_html=True)
st.image("https://images.unsplash.com/photo-1550751822256-00808c92fc8d?ixlib=rb-4.0.3&ixid=M3wxMjA3fDB8MHxwaG90by1wYWdlfHx8fGVufDB8fHx8fA%3D%3D&auto=format&fit=crop&w=1200&q=80",
caption="精准营销示意图", use_column_width=True)
with col2:
option = st.radio("", ["🚀 训练新模型 - 使用新数据训练预测模型", "🔍 模型分析 - 查看现有模型的分析结果"], index=0, label_visibility="hidden")
if "训练新模型" in option:
st.markdown("<div class='model-box'><h4>模型训练</h4><p>上传训练数据并训练新的预测模型</p></div>", unsafe_allow_html=True)
train_file = st.file_uploader("上传训练数据 (CSV格式)", type=["csv"], accept_multiple_files=False)
if train_file is not None:
try:
with tempfile.TemporaryDirectory() as tmpdir:
tmp_path = os.path.join(tmpdir, "large_file.csv")
with open(tmp_path, "wb") as f:
f.write(train_file.getvalue())
def detect_encoding(file_path):
with open(file_path, 'rb') as f:
raw_data = f.read(10000)
result = chardet.detect(raw_data)
return result['encoding']
detected_encoding = detect_encoding(tmp_path)
st.info(f"检测到文件编码: {detected_encoding}")
chunksize = 256 * 1024 * 1024
na_values_list = ['', '#N/A', '#N/A N/A', '#NA', '-1.#IND', '-1.#QNAN', '-NaN', '-nan',
'1.#IND', '1.#QNAN', '<NA>', 'N/A', 'NA', 'NULL', 'NaN', 'n/a', 'nan', 'null']
# 定义特殊列的数据类型
special_dtypes = {
'MAX_PRICE_COMPANY': 'object',
'MAX_PRICE_MODEL': 'object',
'MAX_PRICE_TERM_TYPE': 'object',
'MOBLE_4G_CNT_LV': 'object',
'MOBLE_CNT_LV': 'object',
'OWE_AMT_LV': 'object',
'OWE_CNT_LV': 'object',
'PROM_INTEG_ID': 'object',
'TOUS极_CNT_LV': 'object',
'is_rh_next': 'float64'
}
# 尝试读取文件
try:
raw_ddf = dd.read_csv(
tmp_path,
blocksize=chunksize,
dtype=special_dtypes,
encoding=detected_encoding,
na_values=na_values_list,
assume_missing=True,
low_memory=False
)
except UnicodeDecodeError:
st.warning("检测编码读取失败,尝试GB18030编码...")
try:
raw_ddf = dd.read_csv(
tmp_path,
blocksize=chunksize,
dtype=special_dtypes,
encoding='GB18030',
na_values=na_values_list,
assume_missing=True,
low_memory=False
)
except UnicodeDecodeError:
st.warning("GB18030读取失败,尝试Latin-1编码...")
raw_ddf = dd.read_csv(
tmp_path,
blocksize=chunksize,
dtype=special_dtypes,
encoding='latin-1',
na_values=na_values_list,
assume_missing=True,
low_memory=False
)
except Exception as e:
st.error(f"读取文件时发生错误: {str(e)}")
st.stop()
with st.expander("数据预览", expanded=True):
try:
# 使用compute()获取前1000行
preview_data = raw_ddf.head(1000)
st.dataframe(preview_data)
col1, col2 = st.columns(2)
try:
total_rows = raw_ddf.shape[0].compute()
col1.metric("总样本数", f"{total_rows:,}")
except:
col1.metric("总样本数", "计算中...")
col2.metric("特征数量", len(raw_ddf.columns))
if 'is_rh_next' not in raw_ddf.columns:
st.warning("⚠️ 注意:未找到目标变量 'is_rh_next'")
else:
st.info(f"目标变量类型: {raw_ddf['is_rh_next'].dtype}")
except Exception as e:
st.error(f"数据预览错误: {str(e)}")
st.write("尝试显示前50行...")
try:
preview_data = raw_ddf.head(50)
st.dataframe(preview_data)
except:
st.error("无法显示数据预览")
if st.button("开始数据预处理", use_container_width=True):
with st.spinner("正在进行数据预处理,请稍候..."):
processed_ddf, feature_cols, means, numeric_cols_for_scaling, scaler = preprocess_data(raw_ddf)
preprocessor_params = {
'means': means,
'numeric_cols_for_scaling': numeric_cols_for_scaling,
'scaler': scaler,
'feature_cols': feature_cols
}
joblib.dump(preprocessor_params, 'preprocessor_params.pkl')
processed_ddf.to_csv('processed_data_*.csv', index=False)
st.success("✅ 数据预处理完成!")
# 显示处理后的数据统计
st.subheader("数据质量检查")
with st.spinner("计算缺失值统计..."):
try:
null_counts = processed_ddf.isnull().sum().compute()
st.write("缺失值统计:")
st.dataframe(null_counts[null_counts > 0])
except:
st.warning("缺失值计算失败")
# 可视化关键特征分布
st.subheader("关键特征分布")
try:
sample_ddf = processed_ddf.sample(frac=0.1)
sample_df = sample_ddf.compute()
# 选择存在的列进行可视化
plot_cols = []
if 'AGE' in sample_df.columns: plot_cols.append('AGE')
if 'ONLINE_DAY' in sample_df.columns: plot_cols.append('ONLINE_DAY')
if 'PROM_AMT' in sample_df.columns: plot_cols.append('PROM_AMT')
if 'DWN_VOL' in sample_df.columns: plot_cols.append('DWN_VOL')
if len(plot_cols) >= 4:
fig, axes = plt.subplots(2, 2, figsize=(12, 10))
for i, col in enumerate(plot_cols[:4]):
sns.histplot(sample_df[col], ax=axes[i//2, i%2], kde=True)
plt.tight_layout()
st.pyplot(fig)
else:
st.warning("缺少足够的列进行可视化")
except:
st.error("关键特征分布可视化失败")
# 目标变量分布
st.subheader("目标变量分布")
if 'is_rh_next' in sample_df.columns:
fig, ax = plt.subplots(figsize=(6, 4))
sns.countplot(x='is_rh_next', data=sample_df, ax=ax)
ax.set_xlabel("是否转化 (0=未转化, 1=转化)")
ax.set_ylabel("用户数量")
ax.set_title("用户转化分布")
st.pyplot(fig)
else:
st.warning("未找到目标变量 'is_rh_next'")
# 特征与目标变量相关性
st.subheader("特征与转化的相关性")
if 'is_rh_next' in sample_df.columns:
with st.spinner("计算特征相关性..."):
try:
# 使用采样数据计算相关性
correlation = sample_df[feature_cols + ['is_rh_next']].corr()['is_rh_next'].sort_values(ascending=False)
fig, ax = plt.subplots(figsize=(10, 6))
sns.barplot(x=correlation.values, y=correlation.index, ax=ax)
ax.set_title("特征与转化的相关性")
st.pyplot(fig)
except:
st.error("特征相关性计算失败")
else:
st.warning("未找到目标变量 'is_rh_next'")
# 模型训练按钮
if st.button("开始模型训练", use_container_width=True):
# 检查预处理文件是否存在
if not any(fname.startswith('processed_data_') for fname in os.listdir('.')):
st.error("请先进行数据预处理")
else:
# 创建Spark会话
spark = create_spark_session()
# 使用通配符读取所有预处理文件
spark_df = spark.read.csv('processed_data_*.csv', header=True, inferSchema=True)
# 加载预处理参数
preprocessor_params = joblib.load('preprocessor_params.pkl')
feature_cols = preprocessor_params['feature_cols']
# 训练模型
with st.spinner("正在训练模型,请耐心等待..."):
results = train_models(spark_df, feature_cols)
# 保存模型结果
joblib.dump(results, 'model_results.pkl')
st.success("🎉 模型训练完成!")
# 显示模型比较
st.subheader("模型性能对比")
model_performance = pd.DataFrame({
'模型': ['逻辑回归', '决策树', '随机森林'],
'准确率': [results['逻辑回归']['accuracy'],
results['决策树']['accuracy'],
results['随机森林']['accuracy']],
'AUC': [results['逻辑回归']['auc'],
results['决策树']['auc'],
results['随机森林']['auc']]
}).sort_values('AUC', ascending=False)
st.table(model_performance.style.format({
'准确率': '{:.2%}',
'AUC': '{:.4f}'
}))
# 最佳模型特征重要性
best_model_name = model_performance.iloc[0]['模型']
best_model = results[best_model_name]['model'].bestModel
st.subheader(f"最佳模型 ({best_model_name}) 分析")
if best_model_name in ['决策树', '随机森林']:
feature_importances = results[best_model_name]['feature_importances']
importance_df = pd.DataFrame({
'特征': feature_cols,
'重要性': feature_importances
}).sort_values('重要性', ascending=False).head(10)
fig, ax = plt.subplots(figsize=(10, 6))
sns.barplot(x='重要性', y='极征', data=importance_df, ax=ax)
ax.set_title('Top 10 重要特征')
st.pyplot(fig)
# 显示最佳模型参数
st.subheader("最佳模型参数")
params = results[best_model_name]['best_params']
param_table = pd.DataFrame({
'参数': [str(param.name) for param in params.keys()],
'值': [str(value) for value in params.values()]
})
st.table(param_table)
except Exception as e:
st.error(f"数据处理错误: {str(e)}")
st.exception(e)
else:
st.markdown("<div class='model-box'><h4>模型分析</h4><p>查看已有模型的详细分析结果</div>", unsafe_allow_html=True)
if not os.path.exists('model_results.pkl'):
st.info("ℹ️ 当前没有可用模型。请先进行模型训练以生成分析报告。")
else:
results = joblib.load('model_results.pkl')
preprocessor_params = joblib.load('preprocessor_params.pkl')
feature_cols = preprocessor_params['feature_cols']
model_choice = st.selectbox(
"选择要分析的模型",
("逻辑回归", "决策树", "随机森林")
)
# 显示模型基本信息
model_info = results[model_choice]
st.markdown(f"""
<div class="card">
<h3>{model_choice}</h3>
<p><strong>AUC得分:</strong> {model_info['auc']:.4f}</p>
<p><strong>准确率:</strong> {model_info['accuracy']:.2%}</p>
</div>
""", unsafe_allow_html=True)
# 显示参数详情
with st.expander("模型参数详情", expanded=False):
params = model_info['best_params']
param_table = pd.DataFrame({
'参数': [str(param.name) for param in params.keys()],
'值': [str(value) for value in params.values()]
})
st.table(param_table)
# 特征重要性分析
if model_choice in ['决策树', '随机森林']:
feature_importances = model_info['feature_importances']
importance_df = pd.DataFrame({
'特征': feature_cols,
'重要性': feature_importances
}).sort_values('重要性', ascending=False)
st.subheader("特征重要性分析")
top_features = importance_df.head(10)
fig, ax = plt.subplots(figsize=(10, 6))
sns.barplot(x='重要性', y='特征', data=top_features, ax=ax)
ax.set_title('Top 10 重要特征')
st.pyplot(fig)
fig, ax = plt.subplots(figsize=(10, 6))
sns.histplot(importance_df['重要性'], bins=20, ax=ax)
ax.set_title('特征重要性分布')
st.pyplot(fig)
st.write("特征重要性详细数据:")
st.dataframe(importance_df.style.background_gradient(subset=['重要性'], cmap='viridis'))
# 模型比较
st.subheader("与其他模型的对比")
model_performance = pd.DataFrame({
'模型': ['逻辑回归', '决策树', '随机森林'],
'准确率': [results['逻辑回归']['accuracy'], results['决策树']['accuracy'], results['随机森林']['accuracy']],
'AUC': [results['逻辑回归']['auc'], results['决策树']['auc'], results['随机森林']['auc']]
}).sort_values('AUC', ascending=False)
fig, ax = plt.subplots(figsize=(10, 6))
model_performance.set_index('模型')[['AUC', '准确率']].plot(kind='bar', ax=ax)
ax.set_title('模型性能对比')
ax.set_ylabel('评分')
plt.xticks(rotation=0)
st.pyplot(fig)
st.table(model_performance.style.format({
'准确率': '{:.2%}',
'AUC': '{:.4f}'
}).apply(lambda x: ['background: lightgreen' if x.name == model_performance.index[0] else '' for _ in x]))
# 页脚
st.markdown("—")
st.markdown("""
<div style="text-align: center; color: #7f8c8d; font-size: 0.9rem; padding: 1rem;">
© 2023 单宽转融用户预测系统 | 2231030273 基于Streamlit和Spark开发
</div>
""", unsafe_allow_html=True)
执行如上代码提示如下报错,给出修改后完整代码
数据预览错误: Mismatched dtypes found in pd.read_csv/pd.read_table.
+--------------+--------+----------+ | Column | Found | Expected | +--------------+--------+----------+ | TOUSU_CNT_LV | object | float64 | +--------------+--------+----------+
The following columns also raised exceptions on conversion:
TOUSU_CNT_LV ValueError("could not convert string to float: 'a1'")
Usually this is due to dask's dtype inference failing, and may be fixed by specifying dtypes manually by adding:
dtype={'TOUSU_CNT_LV': 'object'}
to the call to read_csv/read_table.
尝试显示前50行...
无法显示数据预览
最新发布


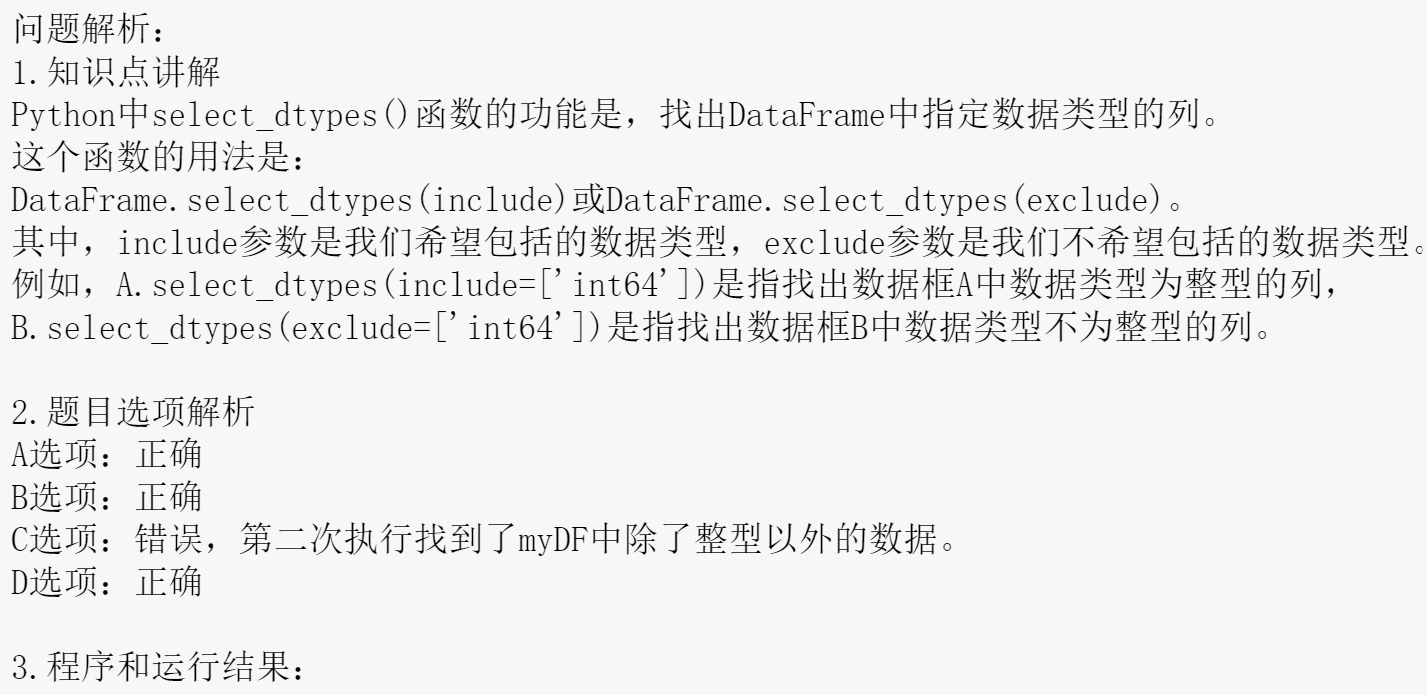
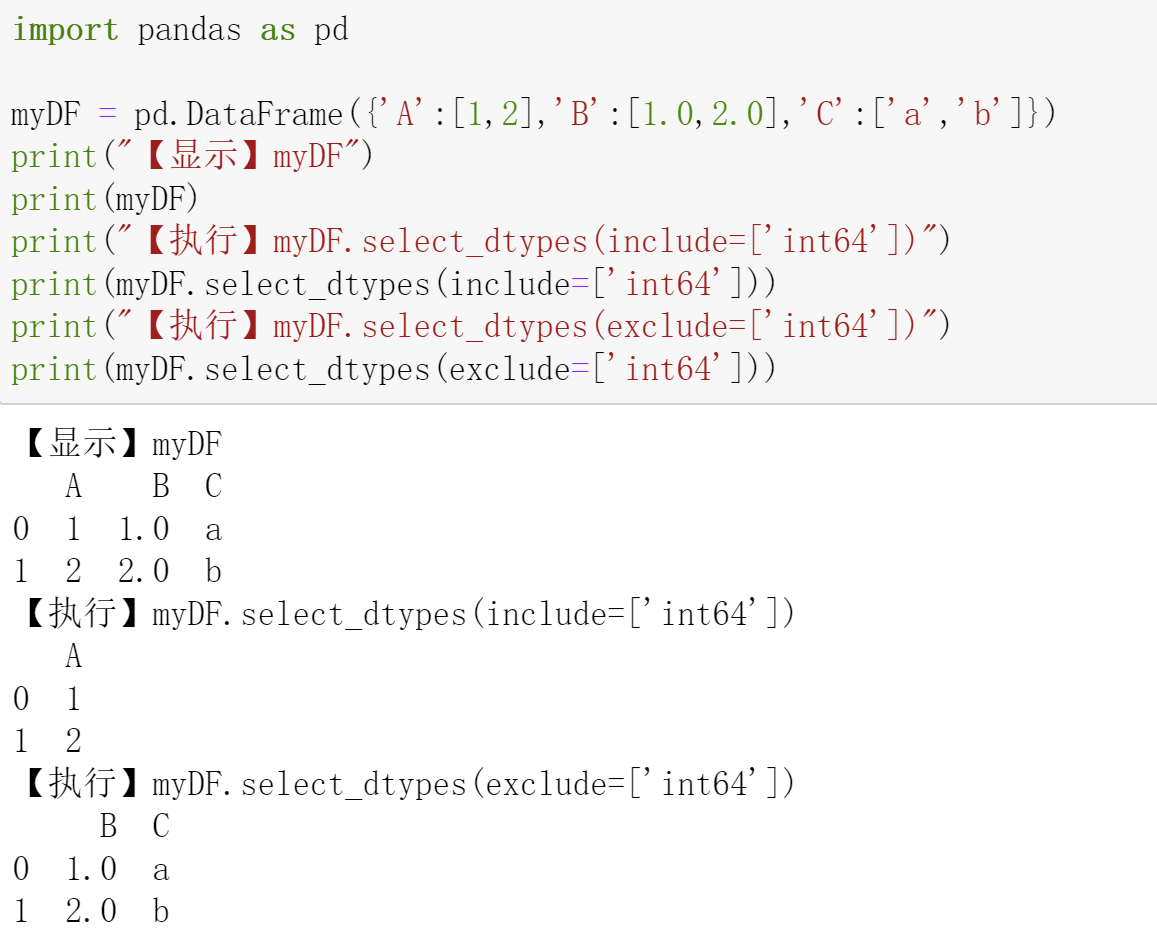
 本文通过一个具体的例子介绍了如何使用pandas库中的select_dtypes()函数来筛选DataFrame中特定数据类型的列。该函数提供了两种方式:一是通过include参数来指定包含的数据类型;二是通过exclude参数来排除特定的数据类型。


 614
614

 被折叠的 条评论
为什么被折叠?
被折叠的 条评论
为什么被折叠?
 到【灌水乐园】发言


