


 本文介绍了如何在Python中使用geopandas处理地理数据,通过自定义颜色字典对`level_plot`列进行映射,并在绘图时展示不同等级的颜色。作者展示了如何将特定值映射为黄色并处理缺失值。
1、自定义colors
NAN=np.nan
colors = {'huangse': '#FCFD28','lanse': '#1F6EBD','hongse':'#FF0000','chengse':'#ED832F',NAN:'white'}
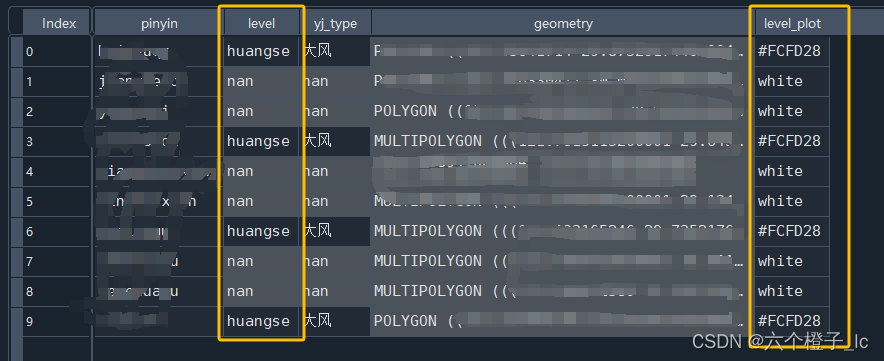
2、针对geodataframe中要渲色的数据进行色值映射
#示例中是对**data_with_geometry**数据中的**level_plot**列的值进行渲染绘制
#**level**中的“huangse”值要被映射为黄色(#FCFD28)被存为新的一列**level_plot**
data_with_geometry['level_plot'] = data_with_geometry['level'].map(colors)
3、对映射后的列进行渲染绘制
p = data_with_geometry.plot(ax=ax,
                            column='level_plot',
                            categorical=True, # 以数值分类的方式展示
                            legend=True,
                            label='等级',
                            color=data_with_geometry['**level_plot**'],
                            missing_kwds={
                                "color": "lightgrey",
                                "edgecolor": "grey",
                                "hatch": ""
                            },
                            edgecolor='black',alpha=0.6,linewidth=0.1,# 对于分类数据,fmt设置无用
                            legend_kwds={"loc": "center left", "bbox_to_anchor": (1, 0.5), "fmt": "{:.0f}"})


 2667
2667

 被折叠的 条评论
为什么被折叠?
被折叠的 条评论
为什么被折叠?
 到【灌水乐园】发言


