


TraceEvent是内核中一种探测的机制,据说在不使能的时候是没有损耗的。据说使用起来挺简单,但是要看懂着实需要花些力气。
例子
从例子中学习,一般都是比较好的方法。内核开发者也比较nice,在内核源码samples/trace_events目录下就有这么一个例子。
其中文件一共有三个:
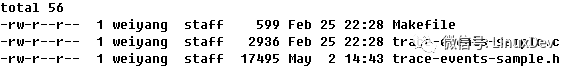
这个例子以内核模块的形式存在,所以只要执行make就可以编译完成。
总的来说,要定义和使用tracepoint,只要做两点。
- 用TRACE_EVENT来定义一个新的tracepoint
- 在需要的地方,使用函数trace_XXX打印输出
有了例子我们就要跑一跑,来看看如何使用的。
首先我们要编译出我们的例子,这时候需要加上打开两个编译配置
- CONFIG_SAMPLES
- CONFIGSAMPLETRACE_EVENTS
编译
make M=samples/trace_events
然后加载这个例子模块
modprobe trace-events-sample
因为用户接口在debugfs上,所以还要确保debugfs挂载了。
mount -t debugfs none /sys/kernel/debug/
此时我们就能在 /sys/kernel/debug/tracing/events/sample-trace/ 目录下看到该模块创建好的trace event了。
接下来,我们就可以打开这个探测时间,并且查看探测的输出了。
cd /sys/kernel/debug/tracing echo 1 > events/sample-trace/enable cat trace echo 0 > events/sample-trace/enable
通过cat trace观察,可以看出系统运行时的一些状态。
让我们进一步再来看看events/sample-trace这个目录:
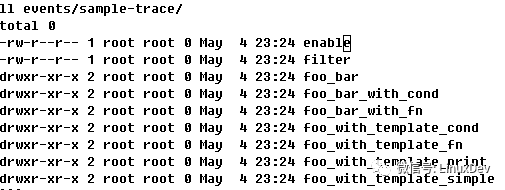
可以看到
- 目录名称sample-trace由TRACE_SYSTEM这个宏定义,所以通过查找这个宏,就能知道有多少events的大类
- 每一个TRACE_EVENT都有一个自己的目录
源文件中trace_XXX的函数就是执行探测记录的地方了。那么这些函数是怎么定义的呢?
TRACE_EVENT定义
看完了例子,我们就该看代码实现了。讲真,这是我见过的最长的宏展开了。之前在qemu上看到的那个hmp-command和这个比起来简直就是个小屁孩。
先来看一下例子中是如何定义一个trace event的。和其他定义不同,定义trace event的定义在头文件,而非源文件。我把trace-events-sample.h文件做一个简要的打开。
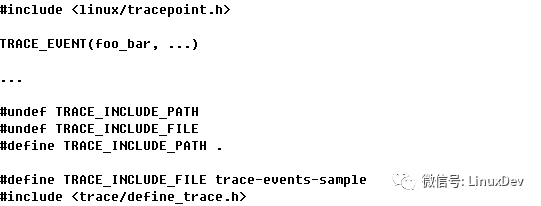
中间我省略了很多TRACEEVENT及其变体,每一个TRACEEVENT对应了一个trace point。
可以看到,一个trace event的定义需要涉及到起码两个头文件。
史上最长宏定义
你以为就这么简单吗?当然不是,作为有多年阅读c语言代码的老司机,看到真正的定义,我都差点没有吐出来。。。
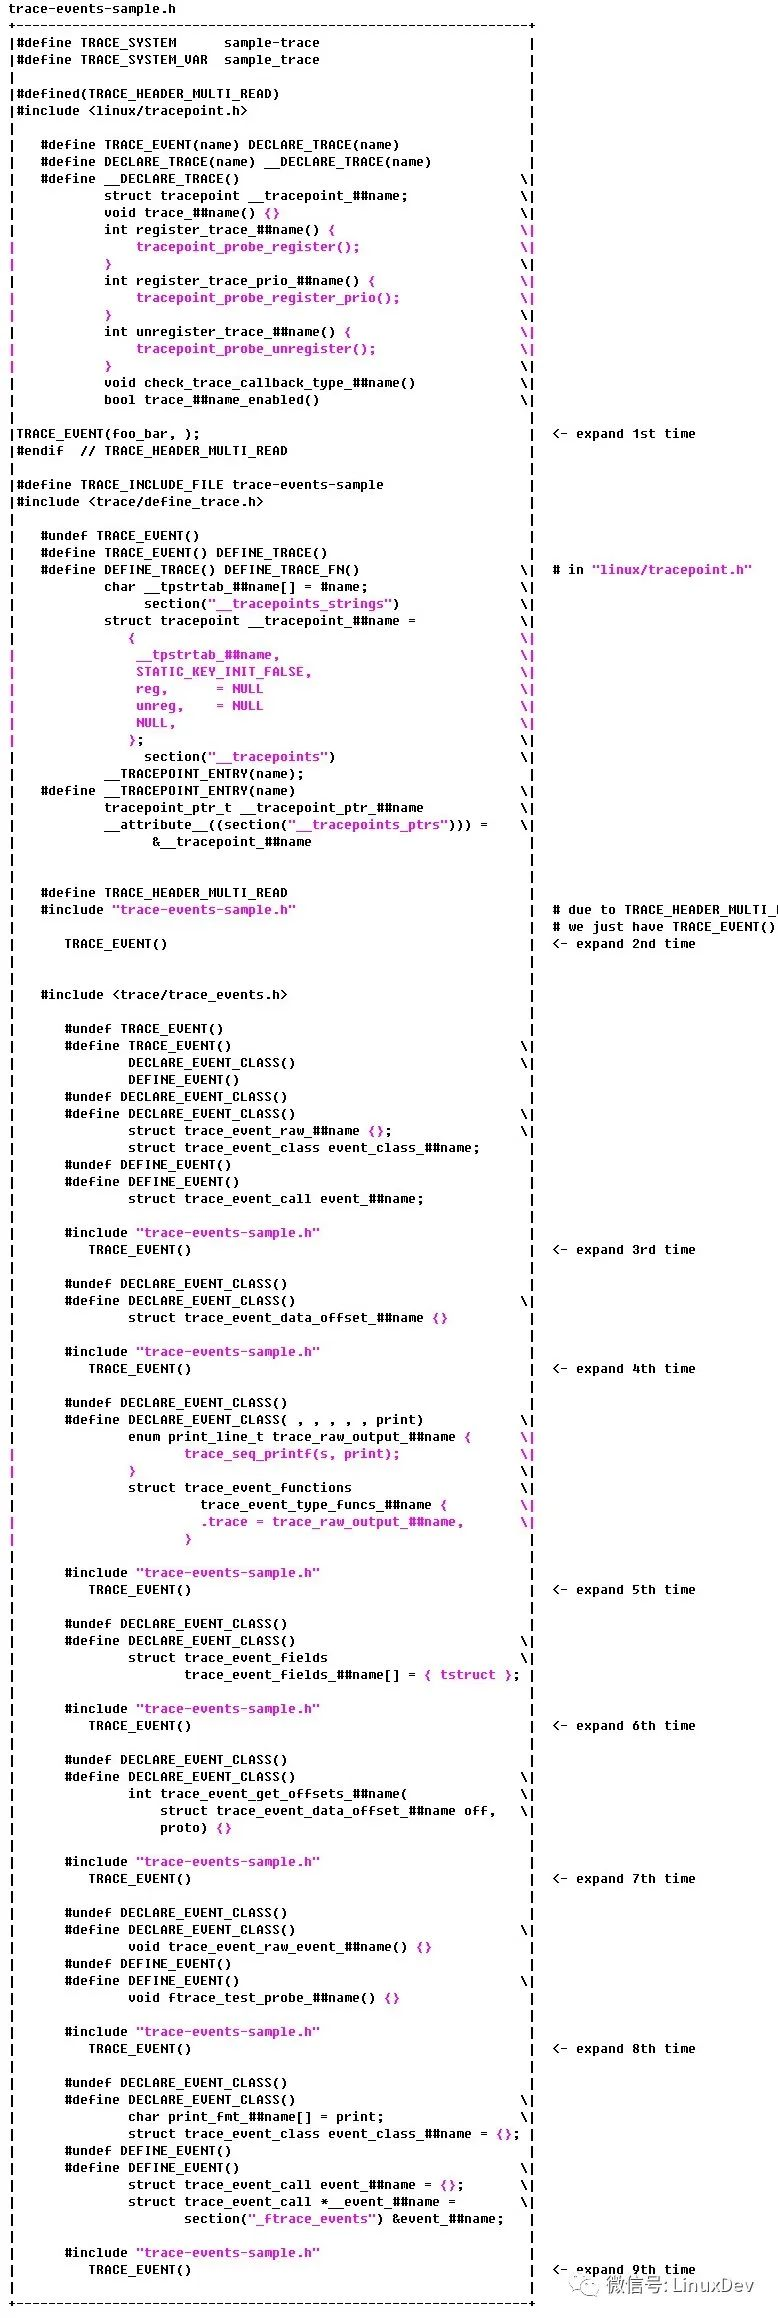
好了,不扯淡了。怎么能很好的解释这个宏展开的过程呢?还是用一张图吧。倒吸一口气,准备一次无尽的代码阅读。具体展开过程可以看后面转载者的补充。
终于完了,也不知道有没有漏掉什么。。。大家如果真的想要看实际代码中展开后的代码,可以运行
make samples/trace_events/trace-events-sample.i
生成的文件是经过预处理后得到的源代码。不过相信我,你可能不太会愿意去看这个(捂脸)
回过头来再看这展开,让我们来总结一下这个过程:
- 一共包含了两个头文件:linux/tracepoint.h 和 trace/define_trace.h
- 在trace/definetrace.h中,反复定义了TRACEEVENT且再次包含samples/trace_events/trace-events-sample.h,实现了一个宏定义多次展开的效果
究竟定义了什么?
哪怕有了上面这个图,我想大部分人也是不会去看的。或者说,看了可能也不知道这些宏展开究竟定义了些什么?
帮人帮到底,送佛送到西
既然都帮大家做了宏展开,那我就干脆再用一张图展示一下这么多宏定义究竟定义了些什么。
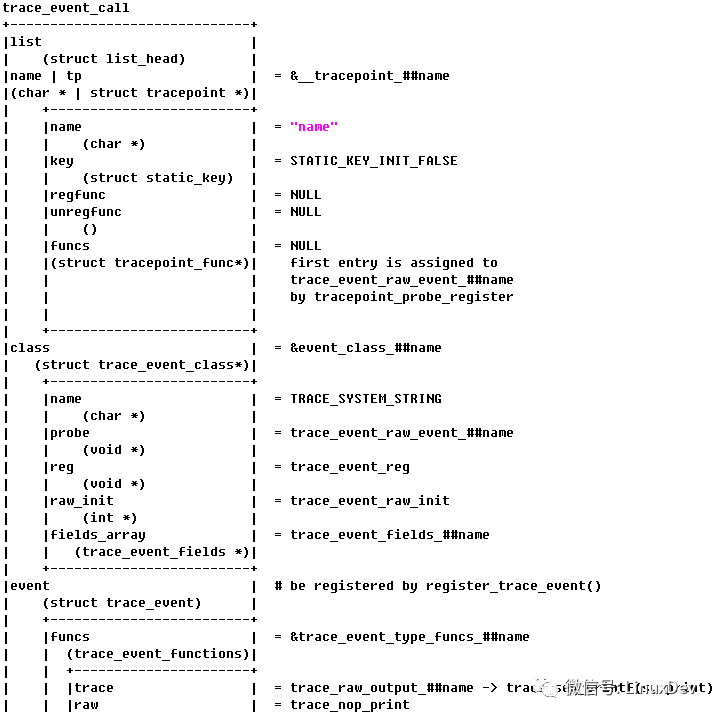
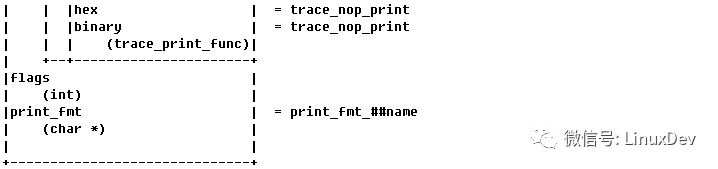
经过了一番云里雾里的宏展开,实际上就是(主要)定义出了这么一个数据结构 -- traceeventcall。而且这个数据结构关联了几个重要的小伙伴
- tracepoint
- trace_event_class
- trace_event
后续,我们将逐渐看到在初始化和使能的过程中,这些数据结构之间的爱恨情仇。
注册trace_event
有了数据结构,想要使用这个功能,我们能想到的第一步就是要把相关的数据结构注册到某个地方,这样下次才能够被使用到是不是?
这个秘密隐藏在了刚才宏展开的最后一次展开中,大家可以回过去搜“section("ftraceevents") &event##name;”。有内核代码经验的朋友可能已经猜到了,这个意思是我们把一部分的内容强制保存在了一个名为ftraceevents的section中。这些是什么呢?对了就是traceevent_call结构体的指针们。
有了这个信息,我们再来看链接文件的定义:
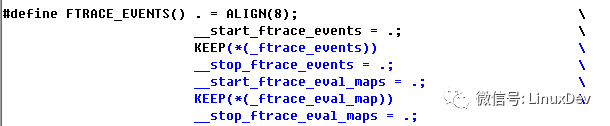
我们看到ftraceevents这个section被包含在_startftrace_events之间。那就沿着这条线继续。
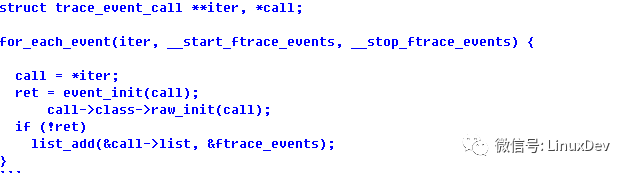
看到了么?我们依次从_start|stopftraceevents之间拿出每一个内容,再执行eventinit()。而这个类型正好是traceeventcall,和刚才的定义吻合上。
但是eventinit()里面又调用了什么call->class->rawinit(call),这是什么个鬼?别急,这个我已经给你写好了。请跳回到刚才解释traceeventcall的图上找找,这个rawinit函数就是traceeventrawinit。最后这个通过registertraceevent将traceeventcall.event注册到系统中,而这个event的类型是trace_event。
怎么样,是不是够刺激的?
最后我们再来展示一下trace_event注册到系统中后的样子吧。
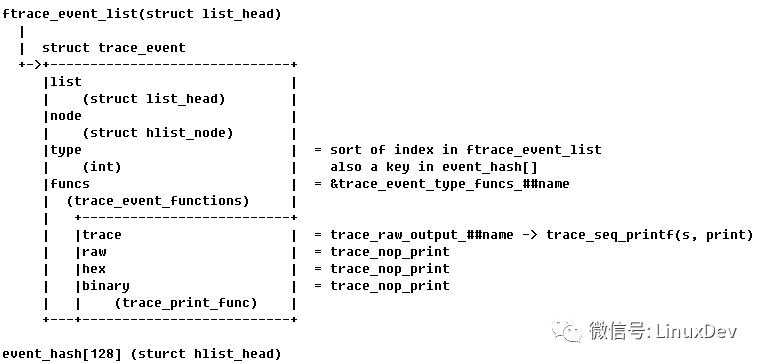
trace_event结构会在两个地方注册:
- ftraceeventlist:这个链表用来遍历事件的号码
- event_hash[128]: 这个哈希表用来查找
有没有看到其中funcs的成员第一个是之前定义的 tracerawoutput_##name?我猜这个就是最后输出到trace文件的代码,你觉得呢?
好了,数据结构注册完了,接下来是什么呢?
注册traceeventcall
在上一节中,我们看到了内核通过编译链接的方法找到了traceeventcall,并且将其中的traceevent注册到了系统中,现在我们来看看traceevent_call是如何注册到系统中的。
这个过程就在event_init()函数下面一点。一共有两个步骤:
- 添加到ftrace_events链表
- 添加到trace_array的events
第一步就在刚才的代码片段中listadd(&call->list, &ftraceevents),而第二步则是通过函数_traceearlyaddevents()。
__trace_early_add_events()
    list_for_each(call, &ftrace_events, list)
    __trace_early_add_new_event(call, tr)
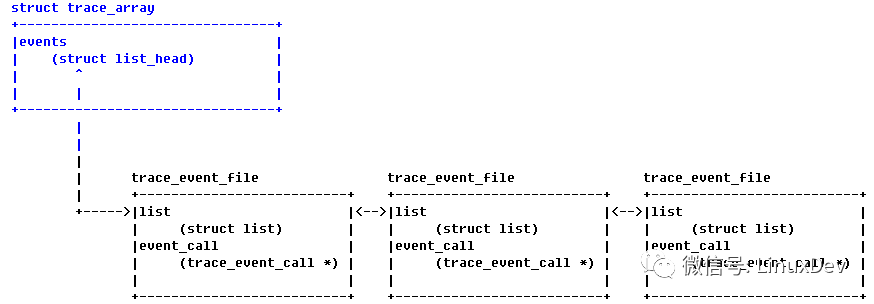
经过这次注册,将traceeventcall和trace_array连接了起来:
创建tracefs
在使用trace工具的时候,会通过tracefs往某些文件里读写来控制ftrace。trace_event也不例外,所以我们要先来看一下tracefs的构建,为后续的代码阅读做好准备。
说起来这个过程有点绕,因为创建tracefs的地方和刚才那些注册函数不在一个地方(系统启动时)。
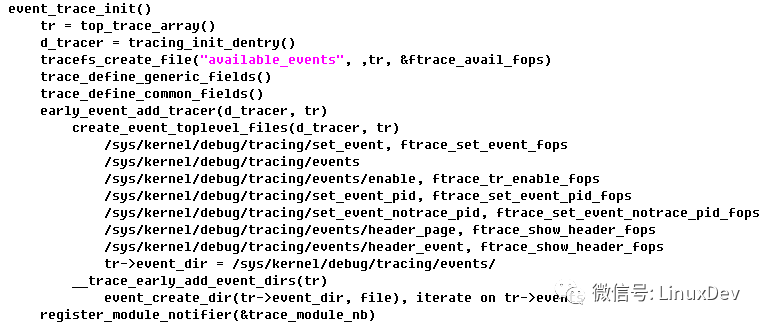
具体细节可以看源代码,这里解释两点:
- createeventtoplevel_files 创建了和trace event相关的根目录的一些文件
- eventcreatedir则是会对每一个tracearray->events上的traceevent_file调用,创建每个event的目录
而这个tracearray->events则是由, 刚才看到的函数traceearlyaddnew_event()添加的。
初始化过程的梳理
到这里估计你已经晕了,没事我自己写得也晕了。让我们来梳理一下整个初始化过程,明确一下这个注册和tracefs的创建顺序。
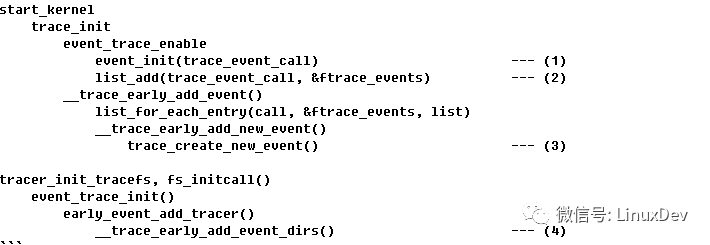
- (1) 从特定的section中拿到traceeventcall数据结构,并注册了trace_event
- (2) 将traceeventcall添加到了ftrace_events链表
- (3) 将每一个traceeventcall以traceeventfile的形式添加到trace_array.events
- (4) 为每一个trace_array.events创建自己的tracefs
废了这么大力气我们都做了什么呢?
关联了tracefs和traceeventfile,也就是我嗯定义的traceeventcall。
所以,每当我们操作一个tracefs文件的时候,后面就对应这相应的traceeventfile和traceeventcall了。
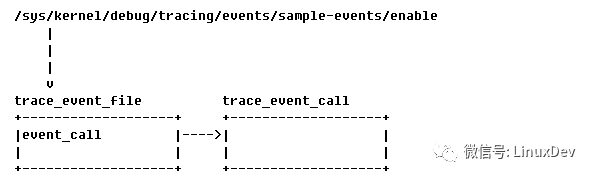
OK, 我们已经为tracefs的操作做好了准备,让我们来看看打开trace event选项时的动作吧。
打开事件
在查看trace文件中的事件记录前,我们需要使能这个事件。
echo 1 > events/sample-trace/enable
所以有个开关来控制事件。而当我们写这个文件的时候,触发到的内核函数就是刚才我们注册tracefs对应的ops中的eventenablewrite。
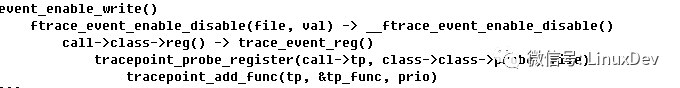
绕晕了,其实呢就是通过某种方式设置了tracepoint结构体中的funcs成员。刚才我们在traceeventcall结构体中已经看到了tracepoint结构,这次该好好看一眼了。
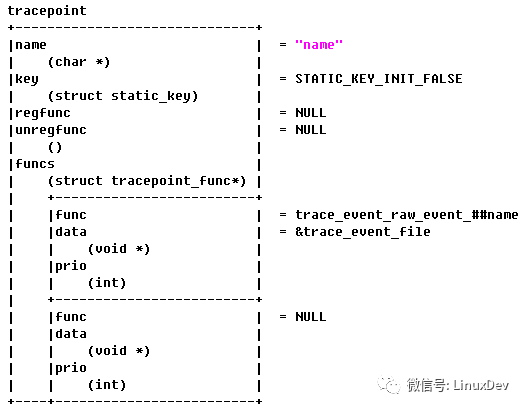
主角终于登场了,经过这么一顿骚操作后,我们将之前定义好的 traceeventrawevent##name挂到了tracepoint的funcs列表中。当然我还省去了重要的一步--设置key。
输出事件
终于到了最后了。之前说的都是定义和初始化,终于要看到调用的情况了。在例子中我们看到,当我们需要输出一个事件时,就会调用trace_XXX()。这次该轮到它出场了。
先来看看trace_XXX这个函数的定义,它也藏在了我们刚才宏定义的展开中,这次我们仔细看一眼
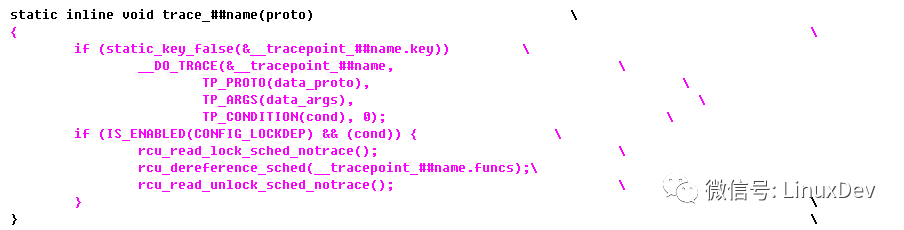
每次我们调用traceXXX()函数的时候,先检查key是否使能了,如果使能了才继续往下走。接着我们再打开DOTRACE来看看。
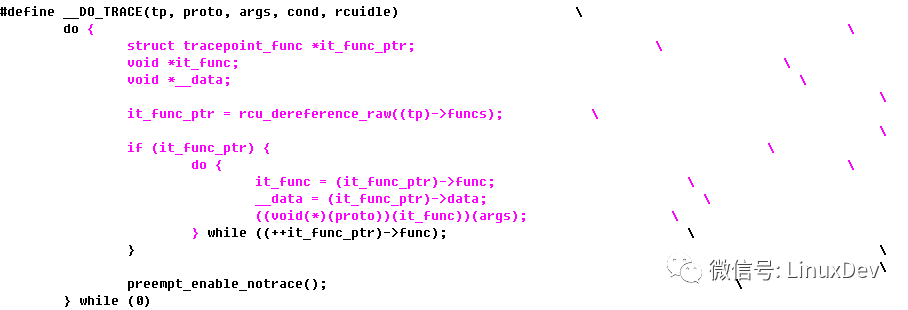
联系上上一小节的tracepoint结构体是不是能想到啥?对了,就是遍历tracepoint->funcs数组,然后调用它们。
好了,终于完整的看完了TRACE_EVENT的定义和使用流程。小编累了,大家也累了,今天就到这里吧。
转载者补充
linux-5.1\samples\trace_events\trace-events-sample.c代码如下:
#include <linux/module.h>
#include <linux/kthread.h>

/*
 * Any file that uses trace points, must include the header.
 * But only one file, must include the header by defining
 * CREATE_TRACE_POINTS first.  This will make the C code that
 * creates the handles for the trace points.
 */
#define CREATE_TRACE_POINTS
#include "trace-events-sample.h"

......
该文件定义了CREATE_TRACE_POINTS,且包含了头文件trace-events-sample.h。
linux-5.1\samples\trace_events\trace-events-sample.h代码如下:
#if !defined(_TRACE_EVENT_SAMPLE_H) || defined(TRACE_HEADER_MULTI_READ)
#define _TRACE_EVENT_SAMPLE_H


#include <linux/tracepoint.h>

......

TRACE_EVENT(foo_bar,

	TP_PROTO(const char *foo, int bar, const int *lst,
		 const char *string, const struct cpumask *mask),

	TP_ARGS(foo, bar, lst, string, mask),

......
#endif

#undef TRACE_INCLUDE_PATH
#undef TRACE_INCLUDE_FILE
#define TRACE_INCLUDE_PATH .


#define TRACE_INCLUDE_FILE trace-events-sample
#include <trace/define_trace.h>
该头文件包含tracepoint.h,linux-5.1\include\linux\tracepoint.h代码如下:
......

#ifndef TRACE_EVENT

......

#define TRACE_EVENT(name, proto, args, struct, assign, print)	\
	DECLARE_TRACE(name, PARAMS(proto), PARAMS(args))

......
#endif /* ifdef TRACE_EVENT (see note above) */
头文件trace-events-sample.h包含tracepoint.h后,tracepoint.h中有TRACE_EVENT的宏定义,故trace-events-sample.h中的宏TRACE_EVENT展开为tracepoint.h中的宏定义。随后文件trace-events-sample.h包含头文件define_trace.h,该文件代码如下:
#ifdef CREATE_TRACE_POINTS

/* Prevent recursion */
#undef CREATE_TRACE_POINTS

......


#undef TRACE_EVENT
#define TRACE_EVENT(name, proto, args, tstruct, assign, print)	\
	DEFINE_TRACE(name)

/* Let the trace headers be reread */
#define TRACE_HEADER_MULTI_READ

#include TRACE_INCLUDE(TRACE_INCLUDE_FILE)

......

#ifdef TRACEPOINTS_ENABLED
#include <trace/trace_events.h>
#include <trace/perf.h>
#include <trace/bpf_probe.h>
#endif

......


/* We may be processing more files */
#define CREATE_TRACE_POINTS

#endif /* CREATE_TRACE_POINTS */
因为文件trace-events-sample.c中定义了CREATE_TRACE_POINTS,所以该头文件内容会被包含。该头文件#undef CREATE_TRACE_POINTS,避免后面包含代码#include TRACE_INCLUDE(TRACE_INCLUDE_FILE)包含trace-events-sample.h时重复包含头文件define_trace.h的内容。
随后#undef TRACE_EVENT,并重新定义了TRACE_EVENT。
代码#define TRACE_HEADER_MULTI_READ是为了随后可以重复包含头文件trace-events-sample.h。因为头文件trace-events-sample.h只要满足#if !defined(_TRACE_EVENT_SAMPLE_H) || defined(TRACE_HEADER_MULTI_READ)就可以重复包含。
随后代码#include TRACE_INCLUDE(TRACE_INCLUDE_FILE)包含了头文件TRACE_INCLUDE_FILE,而该宏在头文件trace-events-sample.h中被定义为trace-events-sample,所以又包含了头文件trace-events-sample.h,所以trace-events-sample.h中的宏TRACE_EVENT(foo_bar,.....)又被展开,只是这次用的是define_trace.h中定义的宏。
随后包含头文件trace/trace_events.h,该头文件代码如下:
#include <linux/trace_events.h>
......


#undef TRACE_EVENT
#define TRACE_EVENT(name, proto, args, tstruct, assign, print) \
	DECLARE_EVENT_CLASS(name,			       \
			     PARAMS(proto),		       \
			     PARAMS(args),		       \
			     PARAMS(tstruct),		       \
			     PARAMS(assign),		       \
			     PARAMS(print));		       \
	DEFINE_EVENT(name, name, PARAMS(proto), PARAMS(args));

......

#undef DECLARE_EVENT_CLASS
#define DECLARE_EVENT_CLASS(name, proto, args, tstruct, assign, print)	\
	struct trace_event_raw_##name {					\
		struct trace_entry	ent;				\
		tstruct							\
		char			__data[0];			\
	};								\
									\
	static struct trace_event_class event_class_##name;

......
#include TRACE_INCLUDE(TRACE_INCLUDE_FILE)

......
#undef DECLARE_EVENT_CLASS
#define DECLARE_EVENT_CLASS(call, proto, args, tstruct, assign, print)	\
	struct trace_event_data_offsets_##call {			\
		tstruct;						\
	};

......
#include TRACE_INCLUDE(TRACE_INCLUDE_FILE)

......
#undef DECLARE_EVENT_CLASS
#define DECLARE_EVENT_CLASS(call, proto, args, tstruct, assign, print)	\
static notrace enum print_line_t					\
trace_raw_output_##call(struct trace_iterator *iter, int flags,		\
			struct trace_event *trace_event)		\
{									\
	struct trace_seq *s = &iter->seq;				\
.......

#include TRACE_INCLUDE(TRACE_INCLUDE_FILE)

......
该头文件#undef TRACE_EVENT,然后重新定义TRACE_EVENT为DECLARE_EVENT_CLASS,随后#undef DECLARE_EVENT_CLASS,并重新定义宏DECLARE_EVENT_CLASS,再包含头文件trace-events-sample.h,然后用新定义的TRACE_EVENT和DECLARE_EVENT_CLASS展开trace-events-sample.h中的宏TRACE_EVENT(foo_bar,.....)。
后面多次重复#undef DECLARE_EVENT_CLASS并重新定义宏DECLARE_EVENT_CLASS,再包含头文件trace-events-sample.h,然后用新定义的TRACE_EVENT和DECLARE_EVENT_CLASS展开trace-events-sample.h中的宏TRACE_EVENT(foo_bar,.....)。


 被折叠的 条评论
为什么被折叠?
被折叠的 条评论
为什么被折叠?
 到【灌水乐园】发言


