import matplotlib.pyplot as plt
%matplotlib inline
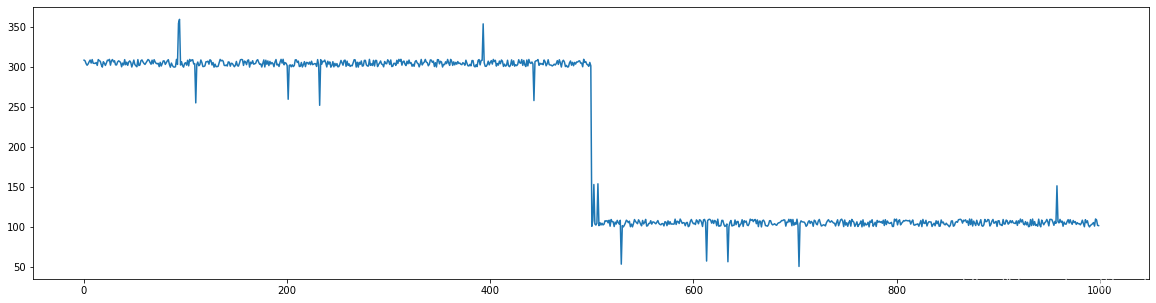
y = np.array([ np.random.random()*10 + 50*int(np.random.random() > 0.99)*np.sign(np.random.random()-0.5) for _ in range(1000)])
y[:len(y)//2] += 200
y += 100
plt.figure(figsize=(20,5))
plt.plot(y)
import rrcf
import numpy as np
import math


num_trees = 20
shingle_size = 1
tree_size = 100
threshold = tree_size * 0.2


X = []
forest = []
scores = []

points = rrcf.shingle(y, size=shingle_size)
for i in range(num_trees):
    tree = rrcf.RCTree(random_state=i)
    forest.append(tree)

for index, point in enumerate(points):
    scorei = []
    for tree in forest:
        if len(tree.leaves) >= tree_size:
            tree.forget_point(index - tree_size)
        tree.insert_point(point, index=index)
        scorei.append(tree.codisp(index))
    scores.append(np.median(scorei))

plt.figure(figsize=(20,5))
plt.subplot(2,1,1)
plt.plot(scores)
plt.subplot(2,1,2)
plt.plot(y)
scores = np.array(scores)
locs = np.where( scores >= threshold)
locs = locs[0]
if len(locs) > 0:
    plt.plot(locs, y[locs], 'ro')
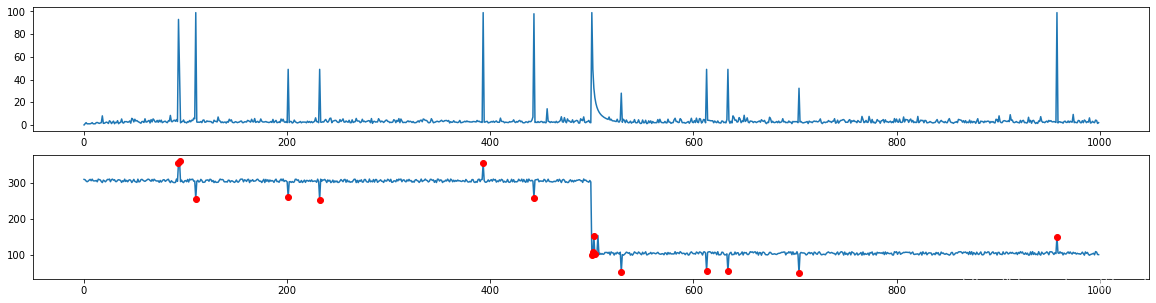


 这段代码展示了如何利用随机森林(Random Forest)和RCTree(Resilient Continuous Tree)来检测时间序列数据中的异常值。首先,生成带有异常点的时间序列数据,然后通过构建多个RCTrees并计算每个点的离群值分数,当分数超过设定阈值时标记为异常。最终,将异常值用红色点在图表上突出显示。


 631
631

 被折叠的 条评论
为什么被折叠?
被折叠的 条评论
为什么被折叠?
 到【灌水乐园】发言


