


 smem是一款用于分析Linux系统中内存使用的工具,它能够提供比传统RSS更准确的PSS报告,真实反映应用及库占用的内存。smem具备多种特性,如按进程、映射或用户进行过滤,配置输出单位和百分比等。
smem is a tool that can give numerous reports on memory usage on Linux systems. Unlike existing tools, smem can report proportional set size (PSS), which is a more meaningful representation of the amount of memory used by libraries and applications in a virtual memory system.
Because large portions of physical memory are typically shared among multiple applications, the standard measure of memory usage known as resident set size (RSS) will significantly overestimate memory usage. PSS instead measures each application's "fair share" of each shared area to give a realistic measure.
smem has many features:
- system overview listing
- listings by process, mapping, user
- filtering by process, mapping, or user
- configurable columns from multiple data sources
- configurable output units and percentages
- configurable headers and totals
- reading live data from /proc
- reading data snapshots from directory mirrors or compressed tarballs
- lightweight capture tool for embedded systems
- built-in chart generation
smem has a few requirements:
- a reasonably modern kernel (> 2.6.27 or so)
- a reasonably recent version of Python (2.4 or so)
- the matplotlib library for chart generation (optional, auto-detected)
Sample output
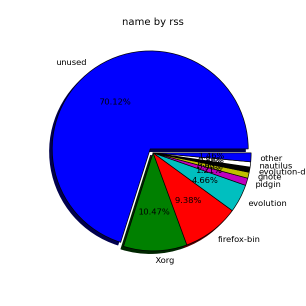
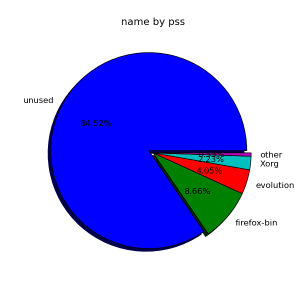
Here are some smem graphs showing how RSS exaggerates memory usage. Note how apps that share libraries are over-reported on the RSS side and nearly vanish on the PSS side. The X server is also shares memory heavily, it's real memory usage is about 5 times smaller.
Using smem
| Show basic process information | smem |
| Show library-oriented view | smem -m |
| Show user-oriented view | smem -u |
| Show system view | smem -R 4G -K /path/to/vmlinux -w |
| Show totals and percentages | smem -t -p |
| Show different columns | smem -c "name user pss" |
| Sort by reverse RSS | smem -s rss -r |
| Show processes filtered by mapping | smem -M libxml |
| Show mappings filtered by process | smem -m -P [e]volution |
| Read data from capture tarball | smem --source capture.tar.gz |
| Show a bar chart labeled by pid | smem --bar pid -c "pss uss" |
| Show a pie chart of RSS labeled by name | smem --pie name -s rss |
Getting smem
To get the latest release version, click here.
The latest source code can be grabbed from smem's Mercurial repository here with the command:
hg clone http://selenic.com/repo/smem
Feedback
Write to the smem list at smem@selenic.com.


 505
505

 被折叠的 条评论
为什么被折叠?
被折叠的 条评论
为什么被折叠?
 到【灌水乐园】发言


