


 本文介绍了一种在Web应用程序中创建数据透视表的方法,通过将二维数据转换为三维视图,提高了数据的可读性和分析效率。
出处:http://www.cnblogs.com/zhuqil/archive/2010/01/07/1640772.html
代码: /Files/zhuqil/Pivot.zip
数据透视表提供的数据三维视图效果,在Microsoft Excel能创建数据透视表,但是,它并不会总是很方便使用Excel。您可能希望在Web应用程序中创建一个数据透视报表。创建一个简单的数据透视表可能是一件非常复杂的任务。所以,我打算不但为你提供一个非常有用的工具创建简单和高级的数据透视表,而且为你移除一些笼罩他们的神秘面纱。
目标是:我们想要有能力将datatable中的二维的数据转换成三维视图。
在大多数情况下,你会从数据库的查询数据填充数据表,例如

 代码
代码
SalesPeople.FullName AS [ SalesPerson ]
,Products.FullName AS [ Product ]
, SUM (Sales.SalesAmount) AS [ SaleAmount ]
, SUM (Sales.Qty) AS [ Quantity ]
FROM
Sales
JOIN
SalesPeople WITH (NOLOCK)
ON SalesPeople.SalesPersonID = Sales.SalesPersonID
JOIN
Products WITH (NOLOCK)
ON Products.ProductCode = Sales.ProductCode
GROUP BY
SalesPeople.FullName
,Products.FullName
该查询会产生下面的数据表:
| Sales Person | Product | Quantity | Sale Amount |
| John | Pens | 200 | 350 |
| John | Pencils | 400 | 500 |
| John | Notebooks | 100 | 300 |
| John | Rulers | 50 | 100 |
| John | Calculators | 120 | 1200 |
| John | Back Packs | 75 | 1500 |
| Jane | Pens | 225 | 393.75 |
| Jane | Pencils | 335 | 418.75 |
| Jane | Notebooks | 200 | 600 |
| Jane | Rulers | 75 | 150 |
| Jane | Calculators | 80 | 800 |
| Jane | Back Packs | 97 | 1940 |
| Sally | Pens | 202 | 353.5 |
| Sally | Pencils | 303 | 378.75 |
| Sally | Notebooks | 198 | 600 |
| Sally | Rulers | 98 | 594 |
| Sally | Calculators | 80 | 800 |
| Sally | Back Packs | 101 | 2020 |
| Sarah | Pens | 112 | 196 |
| Sarah | Pencils | 245 | 306.25 |
| Sarah | Notebooks | 198 | 594 |
| Sarah | Rulers | 50 | 100 |
| Sarah | Calculators | 66 | 660 |
| Sarah | Back Packs | 50 | 2020 |
正如你所看到的,这是一个二维表,它不是一个非常有用的报表。因此,我们得改变,将它变成更可读的数据表。
数据透视表有3个面。
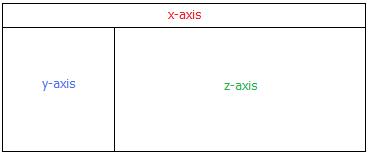
X轴构成了在表格上方的大标题。Y轴构成表的左栏,Z轴构成了X轴和Y轴对应的值。简单的数据透视表将会对每一个x轴值都只有一个z轴列,高级的数据透视表将对于每个X轴的值会对应有多个Z轴的值。
一个非常重要的一点是,Z轴的值只能是数字。这是因为Z轴值为横轴和纵轴的总额。使用一个非数值Z轴字段将抛出一个异常。
因此,如果你注意上面的数据表,你会发现,“Sales Person”和“Product”字段可以分配到的X轴或Y轴,但不能给z轴。在“Quantity”和“Sale Amount”字段可以被分配到z轴。
Pivot 类将数据表转换成html table。然后您可以将它输出到Web窗体上。那么,这只是实现的方法。如果你愿意,你可以根据这个类的逻辑创建一个用户控件。
代码
private DataTable_DataTable;
private string _CssTopHeading;
private string _CssSubHeading;
private string _CssLeftColumn;
private string _CssItems;
private string _CssTotals;
private string _CssTable;
#endregion Variables
#region Constructors
public Pivot(DataTabledataTable)
{
Init();
_DataTable = dataTable;
}
#endregion Constructors
这部分的代码是非常自我解释。 你能创建一个Pivot 对象,通过传递一个datatable作为参数。在init()方法只分配一个空字符串值给CSS变量。如果CSS的变量是一个空字符串,构造方法将使用默认的样式。每一个CSS变量都有一个相应的属性。
代码
{
string zAxisValue = "" ;
try
{
foreach (DataRowrow in _DataTable.Rows)
{
if (Convert.ToString(row[xAxisField]) == xAxisValue && Convert.ToString(row[yAxisField]) == yAxisValue)
{
zAxisValue = Convert.ToString(row[zAxisField]);
break ;
}
}
}
catch
{
throw ;
}
return zAxisValue;
}
在FindValue(...)方法在数据表中搜索的对应x轴和y轴值的Z轴值。xAxisField是X轴字段的列名(例如“Product”),而xAxisValue是在该列的值。该yAxisField是的Y轴字段的列名(例如“Sales Person”),并yAxisValue是在该列的值。该zAxisField是列名,在其中Z轴值,是您正在寻找地(例如“Sale Amount”)。
代码
{
int zAxis = zAxisFields.Length;
if (zAxis < 1 )
zAxis ++ ;
string []zAxisValues = new string [zAxis];
// setdefaultvalues
for ( int i = 0 ;i <= zAxisValues.GetUpperBound( 0 );i ++ )
{
zAxisValues[i] = " 0 " ;
}
try
{
foreach (DataRowrow in _DataTable.Rows)
{
if (Convert.ToString(row[xAxisField]) == xAxisValue && Convert.ToString(row[yAxisField]) == yAxisValue)
{
for ( int z = 0 ;z < zAxis;z ++ )
{
zAxisValues[z] = Convert.ToString(row[zAxisFields[z]]);
}
break ;
}
}
}
catch
{
throw ;
}
return zAxisValues;
}
在FindValues(...)方法类似FindValue(...)方法,然而,它会返回多个z轴的值。这是用于高级的数据透视表,对应于x轴的值,您会有多个Z轴列。
代码
{
if (_CssTopHeading == "" )
{
cell.Style.Add( " font-family " , " tahoma " );
cell.Style.Add( " font-size " , " 10pt " );
cell.Style.Add( " font-weight " , " normal " );
cell.Style.Add( " background-color " , " black " );
cell.Style.Add( " color " , " white " );
cell.Style.Add( " text-align " , " center " );
}
else
cell.Attributes.Add( " Class " ,_CssTopHeading);
}
这是CSS样式的方法之一。这在X轴上使用流行的样式(table的顶行)。如果您没有指定一个CSS类名给这个属性,该方法将使用默认的样式。 CSS类将会被应用到网页中的HTML table。
代码
/// Createsanadvanced3DPivottable.
/// </summary>
/// <paramname="xAxisField"> Themainheadingatthetopofthereport. </param>
/// <paramname="yAxisField"> Theheadingontheleftofthereport. </param>
/// <paramname="zAxisFields"> Thesubheadingatthetopofthereport. </param>
/// <returns> HtmlTableControl. </returns>
public HtmlTablePivotTable( string xAxisField, string yAxisField, string []zAxisFields)
{
HtmlTabletable = new HtmlTable();
// styletable
TableStyle(table);
/*
*Thex-axisisthemainhorizontalrow.
*Thez-axisisthesubhorizontalrow.
*They-axisistheleftverticalcolumn.
*/
try
{
// getdistinctxAxisFields
ArrayListxAxis = new ArrayList();
foreach (DataRowrow in _DataTable.Rows)
{
if ( ! xAxis.Contains(row[xAxisField]))
xAxis.Add(row[xAxisField]);
}
// getdistinctyAxisFields
ArrayListyAxis = new ArrayList();
foreach (DataRowrow in _DataTable.Rows)
{
if ( ! yAxis.Contains(row[yAxisField]))
yAxis.Add(row[yAxisField]);
}
// createa2Darrayforthey-axis/z-axisfields
int zAxis = zAxisFields.Length;
if (zAxis < 1 )
zAxis = 1 ;
string [,]matrix = new string [(xAxis.Count * zAxis),yAxis.Count];
string []zAxisValues = new string [zAxis];
for ( int y = 0 ;y < yAxis.Count;y ++ ) // loopthruy-axisfields
{
// rows
for ( int x = 0 ;x < xAxis.Count;x ++ ) // loopthrux-axisfields
{
// maincolumns
// getthez-axisvalues
zAxisValues = FindValues(xAxisField,Convert.ToString(xAxis[x])
,yAxisField,Convert.ToString(yAxis[y]),zAxisFields);
for ( int z = 0 ;z < zAxis;z ++ ) // loopthruz-axisfields
{
// subcolumns
matrix[(((x + 1 ) * zAxis - zAxis) + z),y] = zAxisValues[z];
}
}
}
// calculatetotalsforthey-axis
decimal []yTotals = new decimal [(xAxis.Count * zAxis)];
for ( int col = 0 ;col < (xAxis.Count * zAxis);col ++ )
{
yTotals[col] = 0 ;
for ( int row = 0 ;row < yAxis.Count;row ++ )
{
yTotals[col] += Convert.ToDecimal(matrix[col,row]);
}
}
// calculatetotalsforthex-axis
decimal [,]xTotals = new decimal [zAxis,(yAxis.Count + 1 )];
for ( int y = 0 ;y < yAxis.Count;y ++ ) // loopthruthey-axis
{
int zCount = 0 ;
for ( int z = 0 ;z < (zAxis * xAxis.Count);z ++ ) // loopthruthez-axis
{
xTotals[zCount,y] += Convert.ToDecimal(matrix[z,y]);
if (zCount == (zAxis - 1 ))
zCount = 0 ;
else
zCount ++ ;
}
}
for ( int xx = 0 ;xx < zAxis;xx ++ ) // GrandTotal
{
for ( int xy = 0 ;xy < yAxis.Count;xy ++ )
{
xTotals[xx,yAxis.Count] += xTotals[xx,xy];
}
}
// BuildHTMLTable
// Appendmainrow(x-axis)
HtmlTableRowmainRow = new HtmlTableRow();
mainRow.Cells.Add( new HtmlTableCell());
for ( int x = 0 ;x <= xAxis.Count;x ++ ) // loopthrux-axis+1
{
HtmlTableCellcell = new HtmlTableCell();
cell.ColSpan = zAxis;
if (x < xAxis.Count)
cell.InnerText = Convert.ToString(xAxis[x]);
else
cell.InnerText = " GrandTotals " ;
// stylecell
MainHeaderTopCellStyle(cell);
mainRow.Cells.Add(cell);
}
table.Rows.Add(mainRow);
// Appendsubrow(z-axis)
HtmlTableRowsubRow = new HtmlTableRow();
subRow.Cells.Add( new HtmlTableCell());
subRow.Cells[ 0 ].InnerText = yAxisField;
// stylecell
SubHeaderCellStyle(subRow.Cells[ 0 ]);
for ( int x = 0 ;x <= xAxis.Count;x ++ ) // loopthrux-axis+1
{
for ( int z = 0 ;z < zAxis;z ++ )
{
HtmlTableCellcell = new HtmlTableCell();
cell.InnerText = zAxisFields[z];
// stylecell
SubHeaderCellStyle(cell);
subRow.Cells.Add(cell);
}
}
table.Rows.Add(subRow);
// Appendtableitemsfrommatrix
for ( int y = 0 ;y < yAxis.Count;y ++ ) // loopthruy-axis
{
HtmlTableRowitemRow = new HtmlTableRow();
for ( int z = 0 ;z <= (zAxis * xAxis.Count);z ++ ) // loopthruz-axis+1
{
HtmlTableCellcell = new HtmlTableCell();
if (z == 0 )
{
cell.InnerText = Convert.ToString(yAxis[y]);
// stylecell
MainHeaderLeftCellStyle(cell);
}
else
{
cell.InnerText = Convert.ToString(matrix[(z - 1 ),y]);
// stylecell
ItemCellStyle(cell);
}
itemRow.Cells.Add(cell);
}
// appendx-axisgrandtotals
for ( int z = 0 ;z < zAxis;z ++ )
{
HtmlTableCellcell = new HtmlTableCell();
cell.InnerText = Convert.ToString(xTotals[z,y]);
// stylecell
TotalCellStyle(cell);
itemRow.Cells.Add(cell);
}
table.Rows.Add(itemRow);
}
// appendy-axistotals
HtmlTableRowtotalRow = new HtmlTableRow();
for ( int x = 0 ;x <= (zAxis * xAxis.Count);x ++ )
{
HtmlTableCellcell = new HtmlTableCell();
if (x == 0 )
cell.InnerText = " Totals " ;
else
cell.InnerText = Convert.ToString(yTotals[x - 1 ]);
// stylecell
TotalCellStyle(cell);
totalRow.Cells.Add(cell);
}
// appendx-axis/y-axistotals
for ( int z = 0 ;z < zAxis;z ++ )
{
HtmlTableCellcell = new HtmlTableCell();
cell.InnerText = Convert.ToString(xTotals[z,xTotals.GetUpperBound( 1 )]);
// stylecell
TotalCellStyle(cell);
totalRow.Cells.Add(cell);
}
table.Rows.Add(totalRow);
}
catch
{
throw ;
}
return table;
}
PivotTable(…) 方法,是所有神奇发生的地方。有两种重载方法,一个创建了一个简单的数据透视表,而其他(上面的方法)创建一个高级的数据透视表。唯一的区别在于,一个简单只有一个的z轴,而高级的,不止一个。
Pivot.zip文件中包括两个解决方案。Pivot 是一个类库解决方案是。您可以编译此解决方案和在Web应用程序中引用Pivot.dll。另一个解决方案是PivotTest,它是是一个ASP.NET应用程序。这说明如何实现Pivot类。
代码
{
get
{
DataTabledt = new DataTable( " SalesTable " );
dt.Columns.Add( " SalesPerson " );
dt.Columns.Add( " Product " );
dt.Columns.Add( " Quantity " );
dt.Columns.Add( " SaleAmount " );
dt.Rows.Add( new object []{ " John " , " Pens " , 200 , 350.00 });
dt.Rows.Add( new object []{ " John " , " Pencils " , 400 , 500.00 });
dt.Rows.Add( new object []{ " John " , " Notebooks " , 100 , 300.00 });
dt.Rows.Add( new


 1080
1080

 被折叠的 条评论
为什么被折叠?
被折叠的 条评论
为什么被折叠?
 到【灌水乐园】发言


